HomeOffice Connectivity
Home Office Connectivity Monitoring
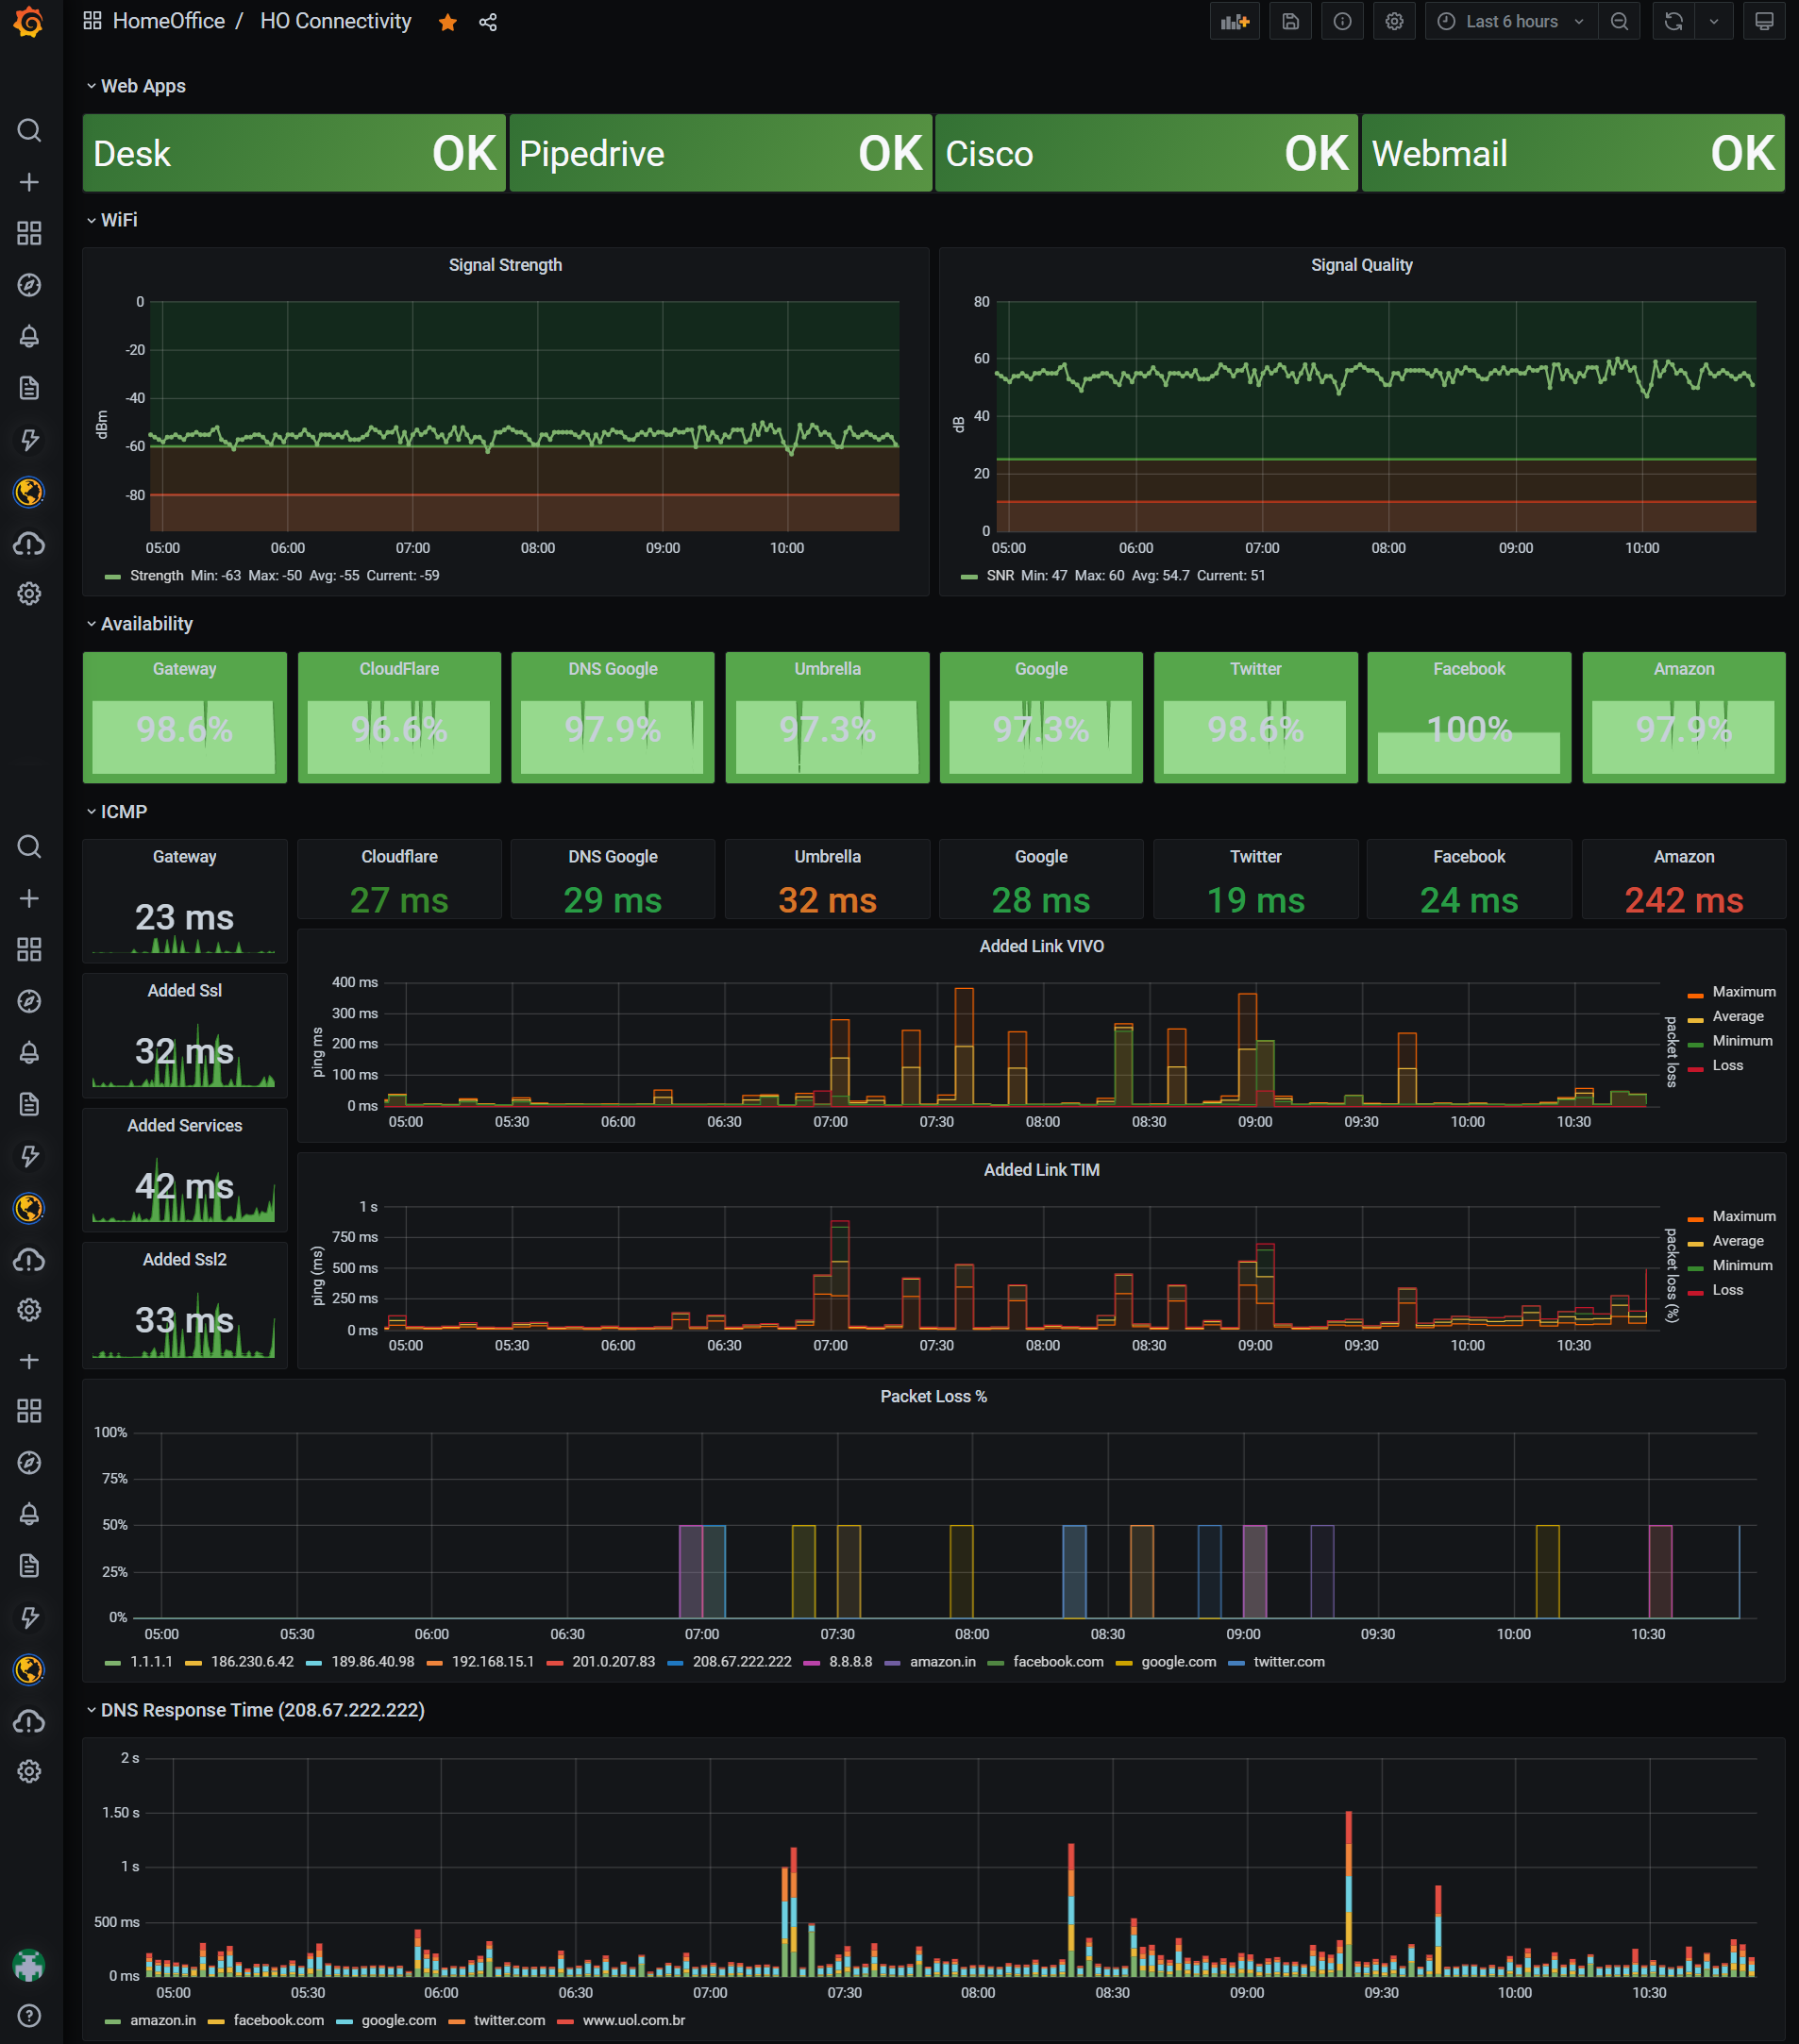
Dashboard for HomeOffice Monitoring. Using Telegraf (ping, dns, http_responde and wireless plugins) + Prometheus we can see the http response code, icmp response time and packet loss, dns response time and wifi status.
Data source config
Collector type:
Collector plugins:
Collector config:
Revisions
Upload an updated version of an exported dashboard.json file from Grafana
| Revision | Description | Created | |
|---|---|---|---|
| Download |