Open Liberty (mpFaultTolerance-3.x)
Displays metrics collected by methods annotated with MicroProfile Fault Tolerance annotations
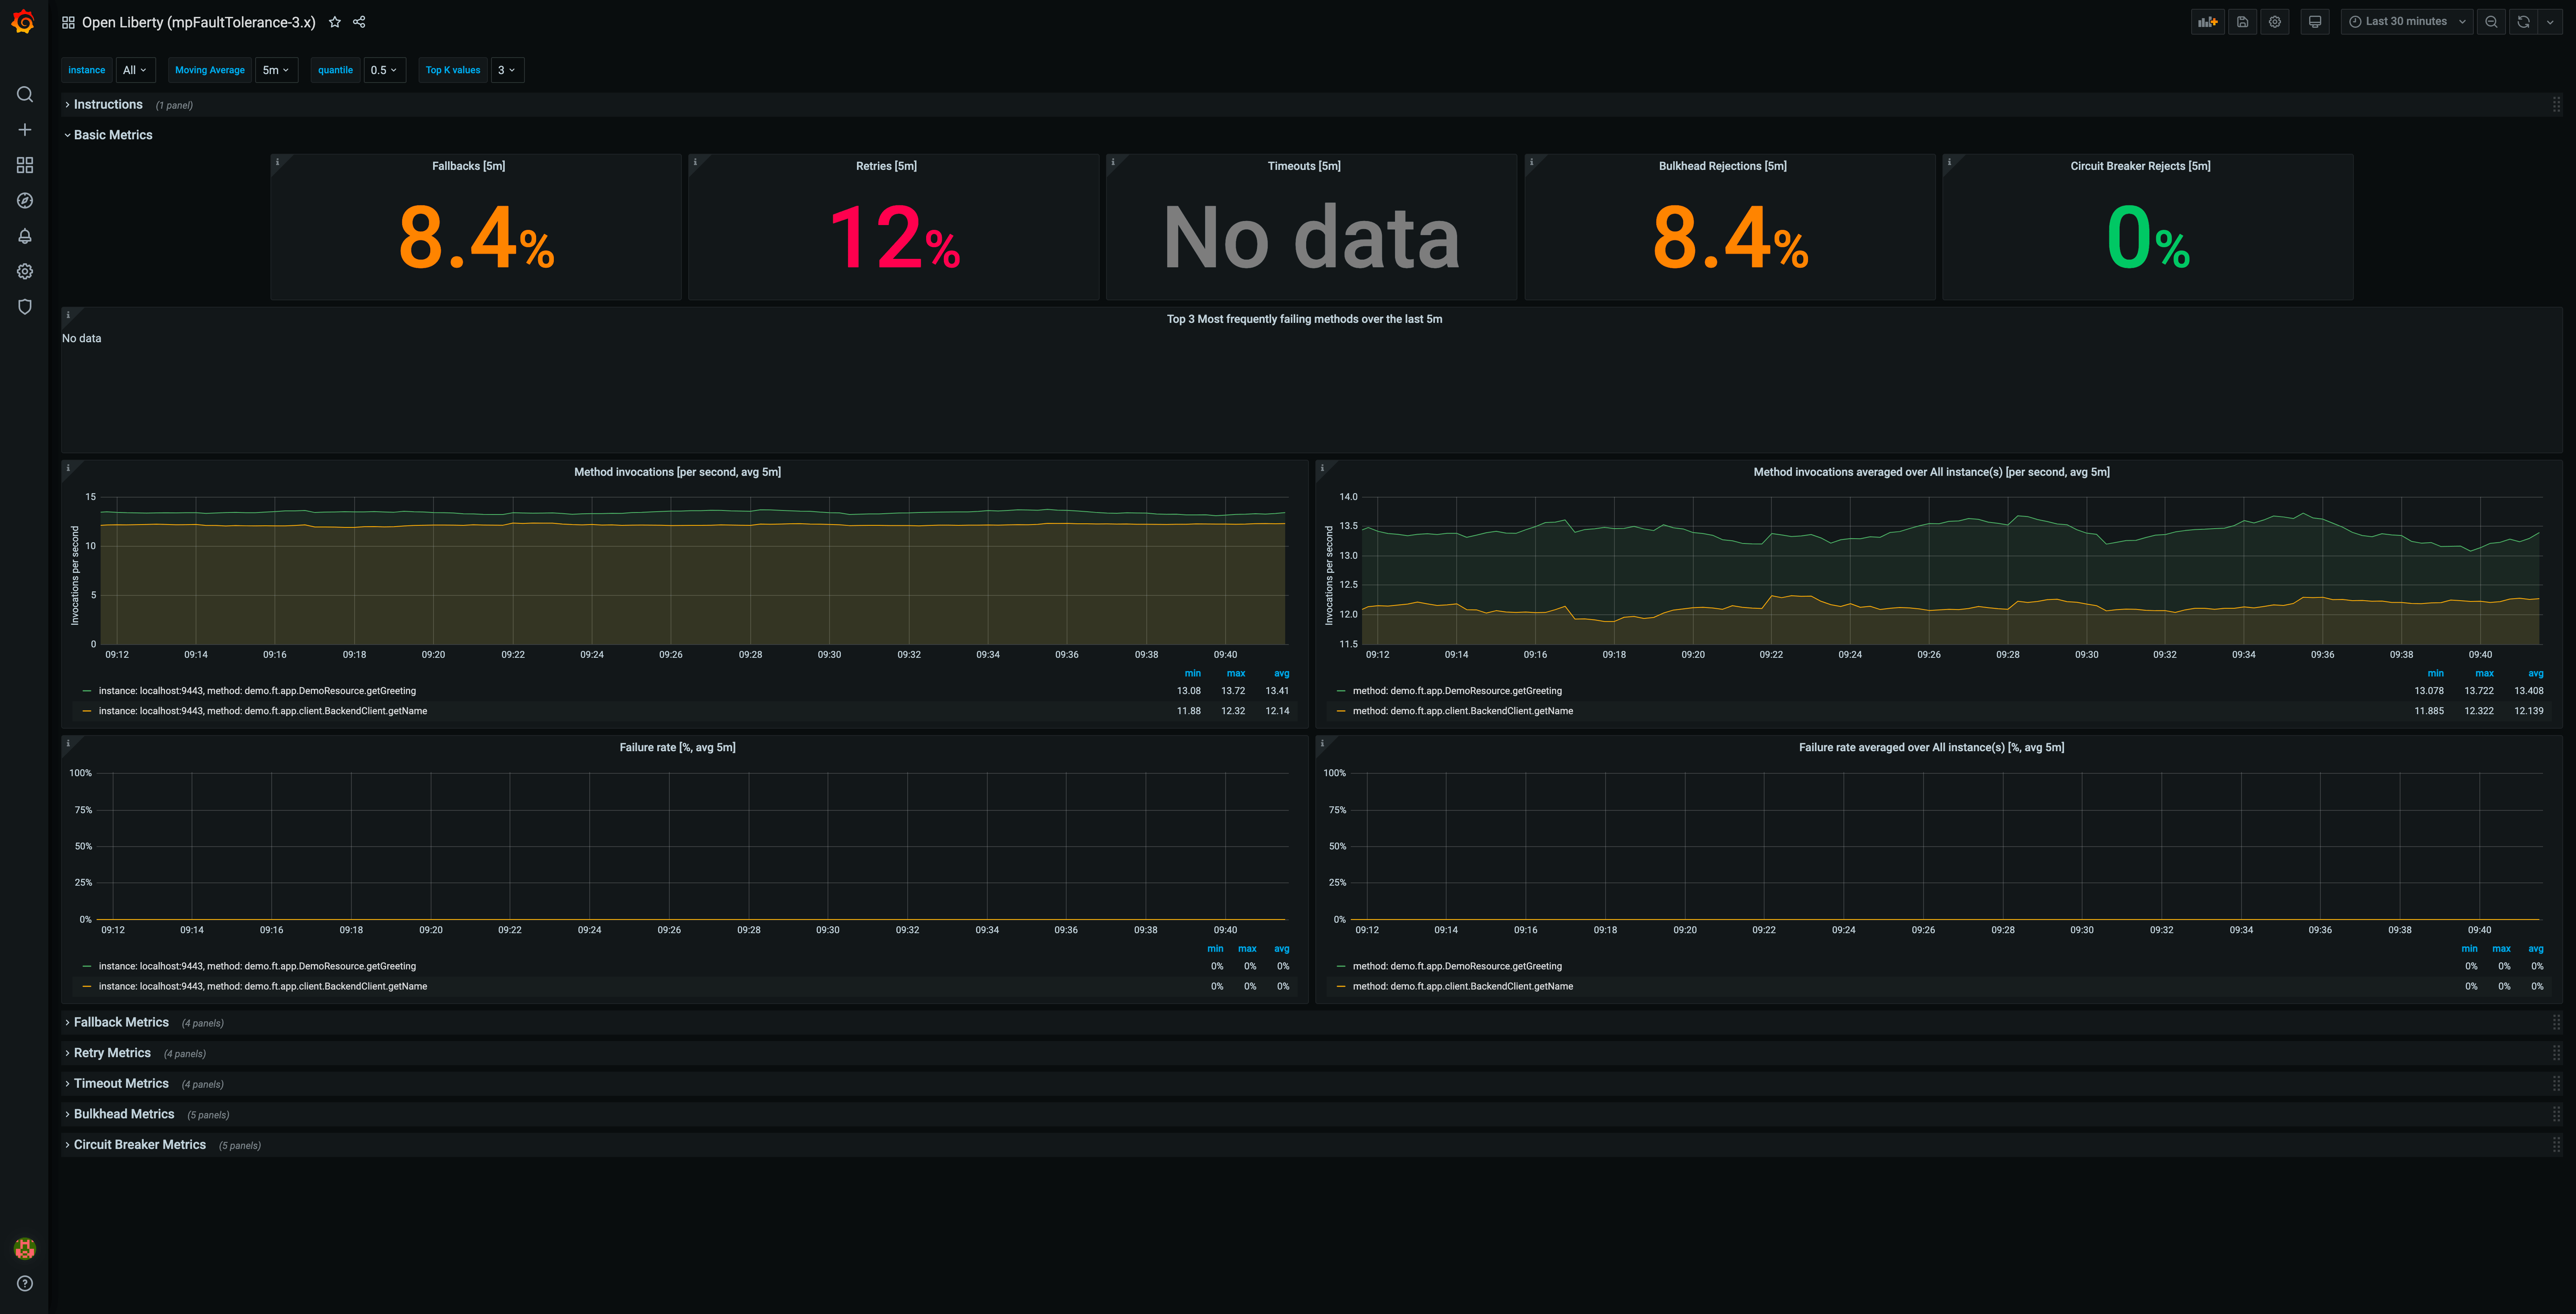
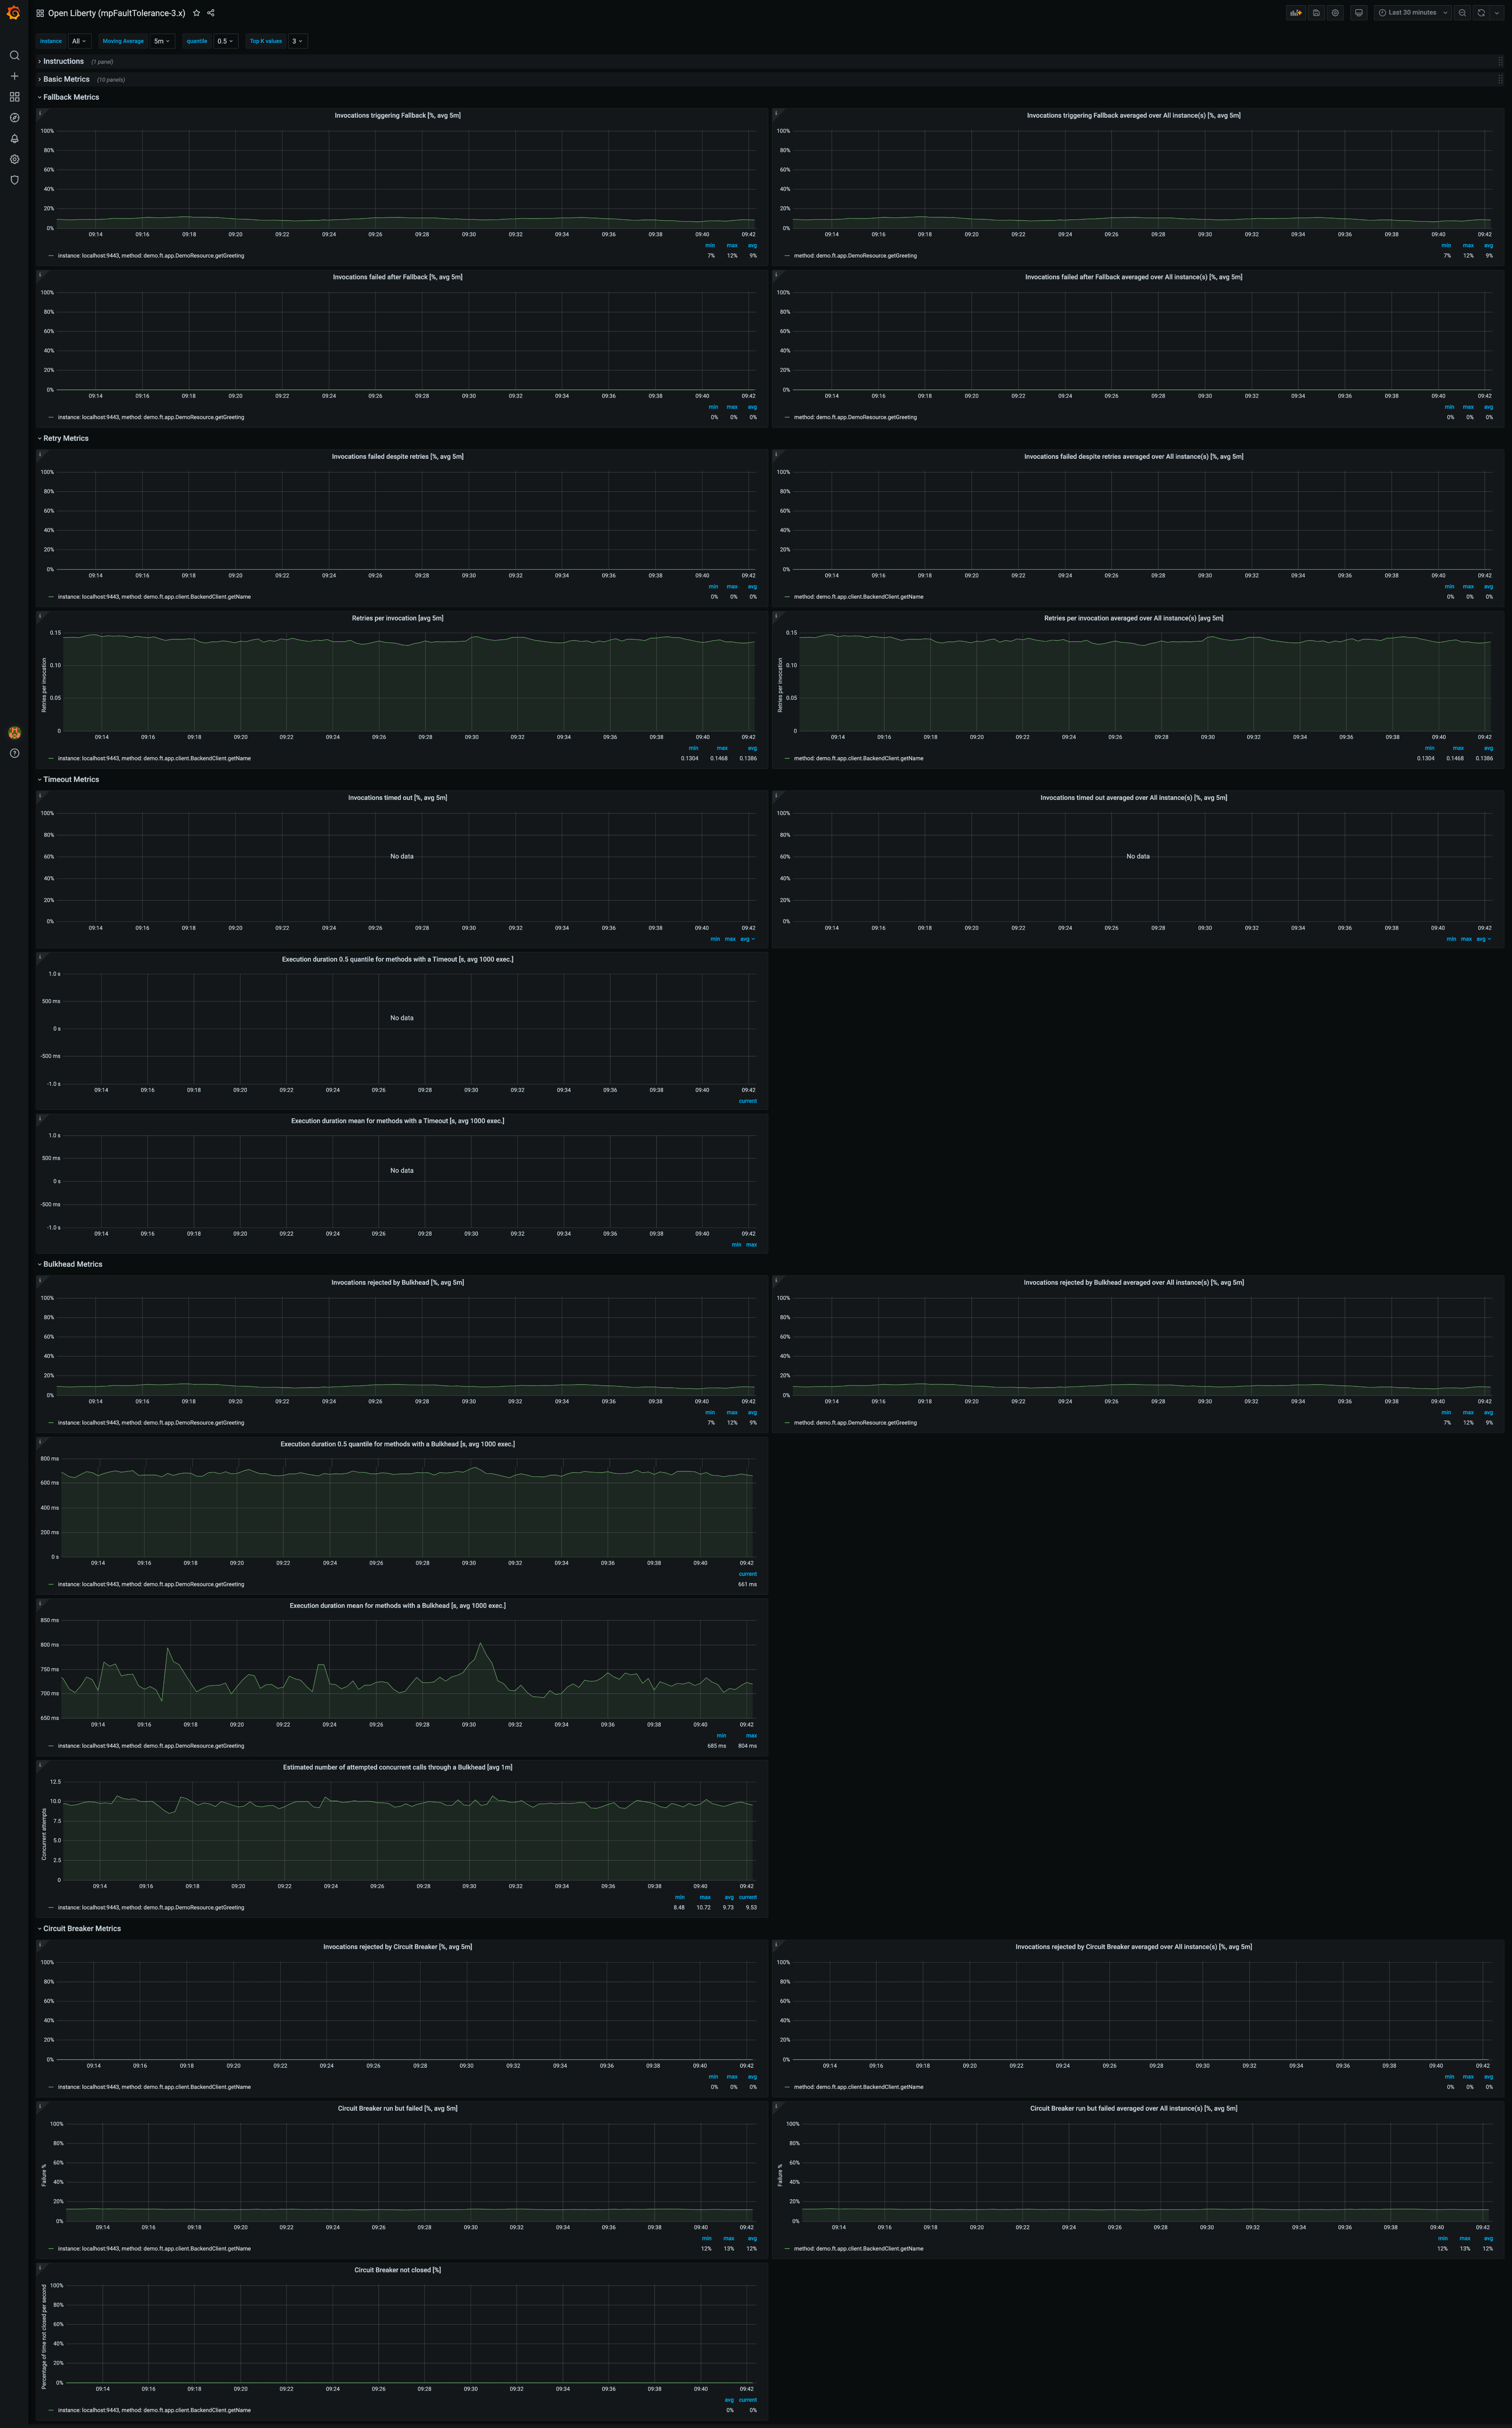
This dashboard visualizes in depth metrics for each of the different MicroProfile Fault Tolerance 3.0 annotations: Fallback, Retry, Timeout, Bulkhead, CircuitBreaker
The dashboard has been tested on Open Liberty running with the mpFaultTolerance-3.0 and mpMetrics-3.0 features, but should work with any server which supports both MicroProfile Fault Tolerance 3.0 and MicroProfile Metrics 3.0 (which are both part of MicroProfile 4.0).
How to use: For instructions on how to set up OpenLiberty with a Grafana dashboard see this blog post. The instructions are for MicroProfile 3.3 so be sure to use the mpMetrics-3.0 and mpFaultTolerance-3.0 features instead of mpMetrics-2.3 and install this dashboard rather than the one linked from the blog post.
Useful links:
Data source config
Collector config:
Upload an updated version of an exported dashboard.json file from Grafana
| Revision | Description | Created | |
|---|---|---|---|
| Download |