ClickHouse
ClickHouse internal exporter metrics
ClickHouse
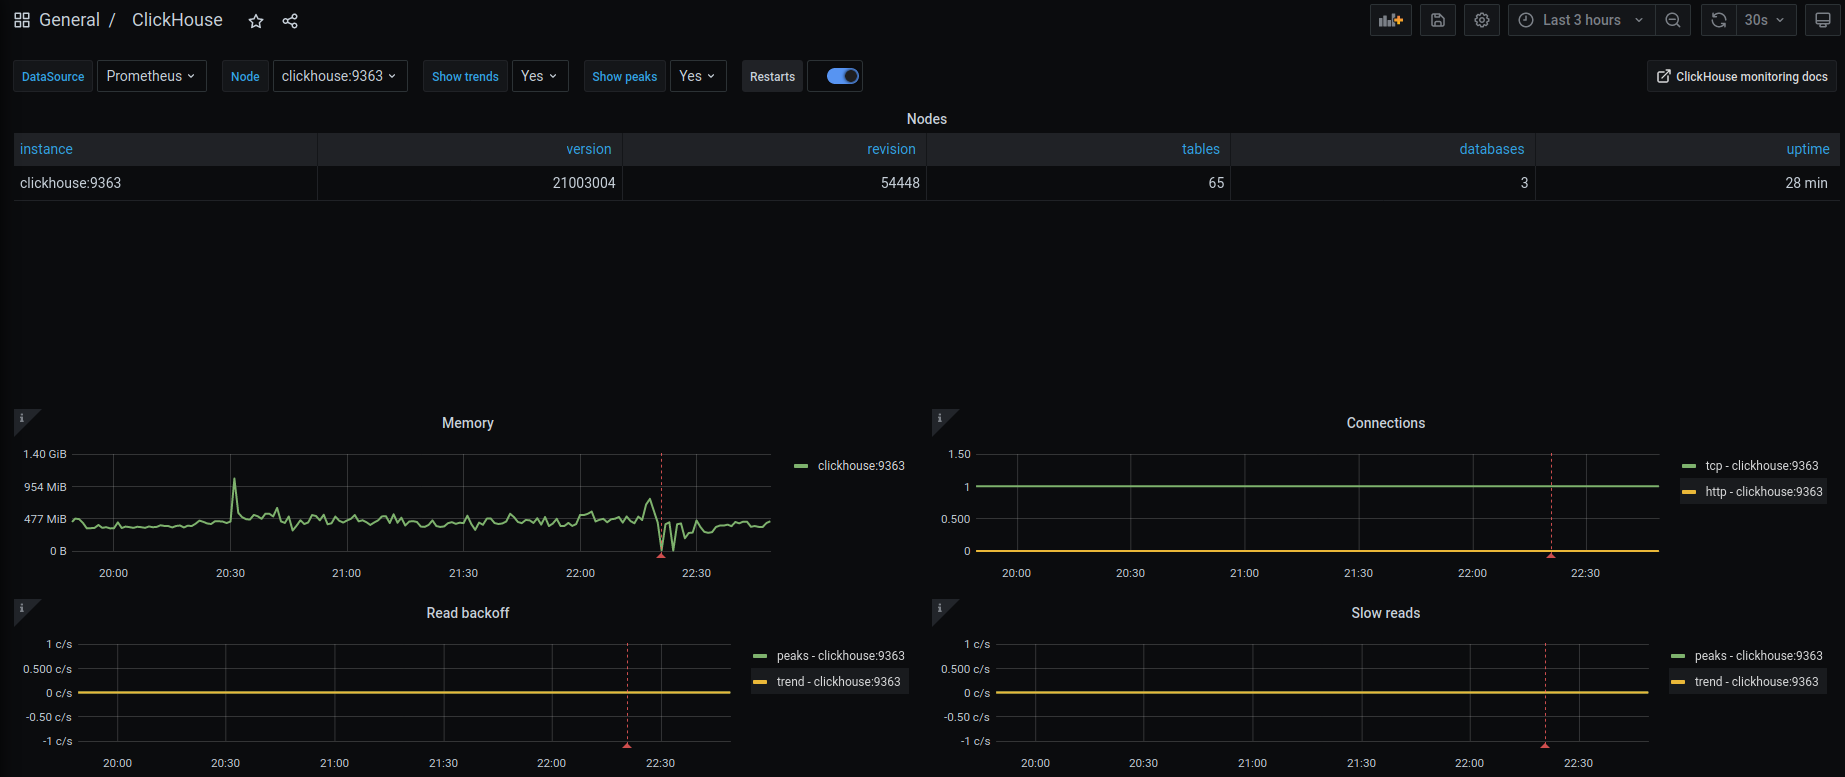
ClickHouse overview dashboard for internal exporter. You can contribute here
Requirements (tested, but may work on older versions too)
- Grafana - 7 and up
- ClickHouse - 21.3.4.25-lts and up
- Prometheus
- ClickHouse internal exporter (how to)
Features
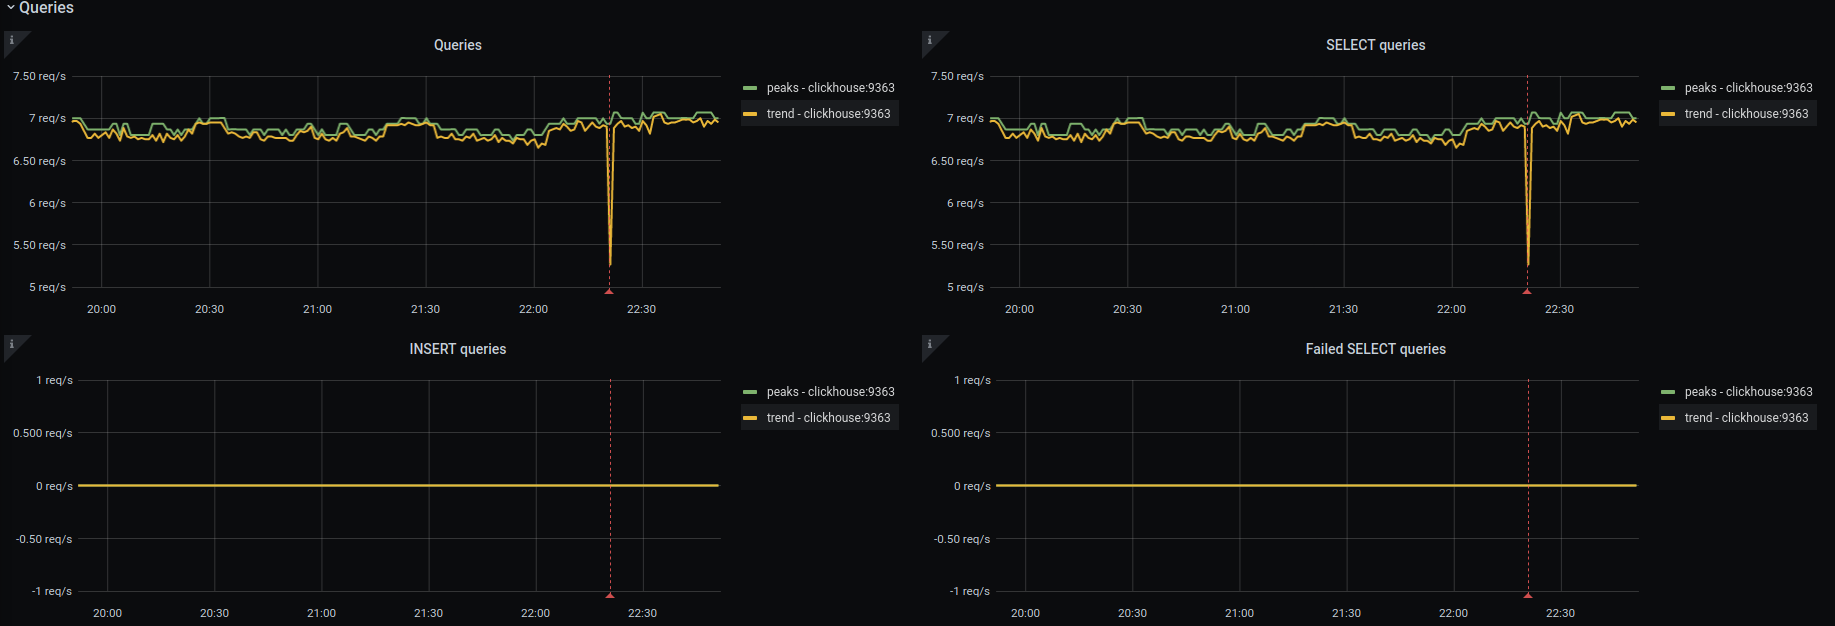
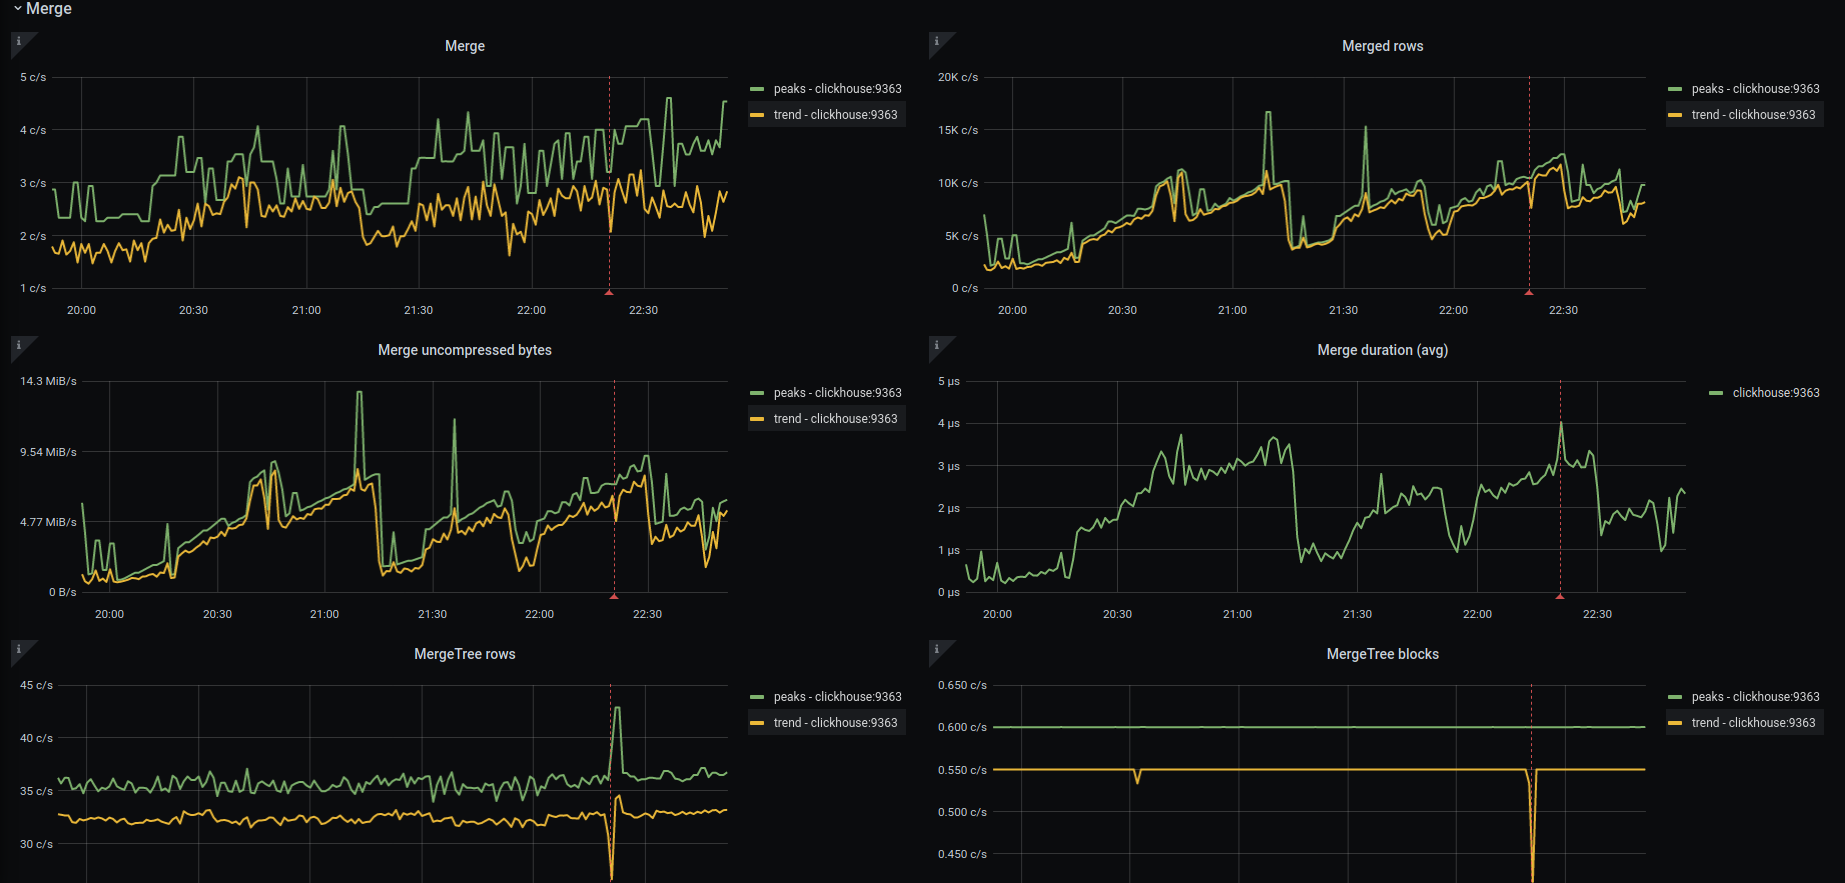
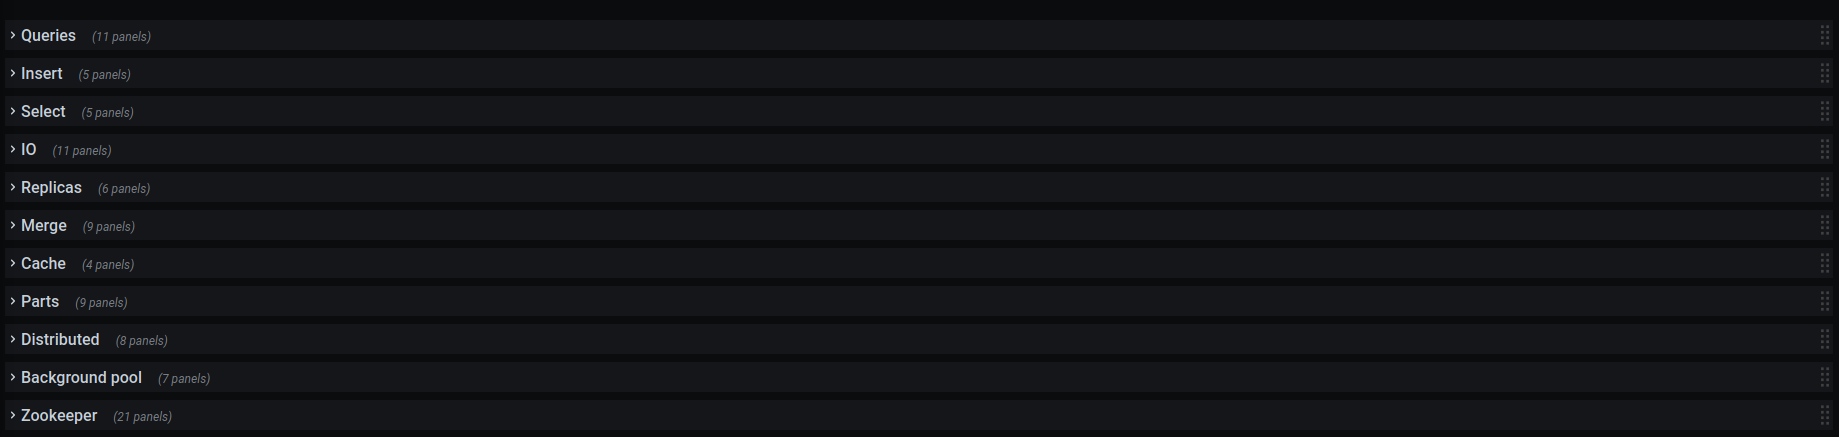
- Info for: Queries (plus Select/Insert details), IO, Replicas, Merges, Zookeeper, Cache, Parts, Distributed tables, Background task pools
- Show both trends and peaks (configurable)
max_over_time+ PromQL subqueries to get all peaks$__rate_intervalto correct rate calc between pointsMax data pointsset to 200 for all graph panel- Table with overall info for selected instances
- Annotation for restart event
Data source config
Collector type:
Collector plugins:
Collector config:
Revisions
Upload an updated version of an exported dashboard.json file from Grafana
| Revision | Description | Created | |
|---|---|---|---|
| Download |
ClickHouse
Monitor ClickHouse with Grafana. Easily keep tabs on your instance or cluster with Grafana Cloud's out-of-the-box monitoring solution.
Learn more