Prometheus disk space consumption evaluation
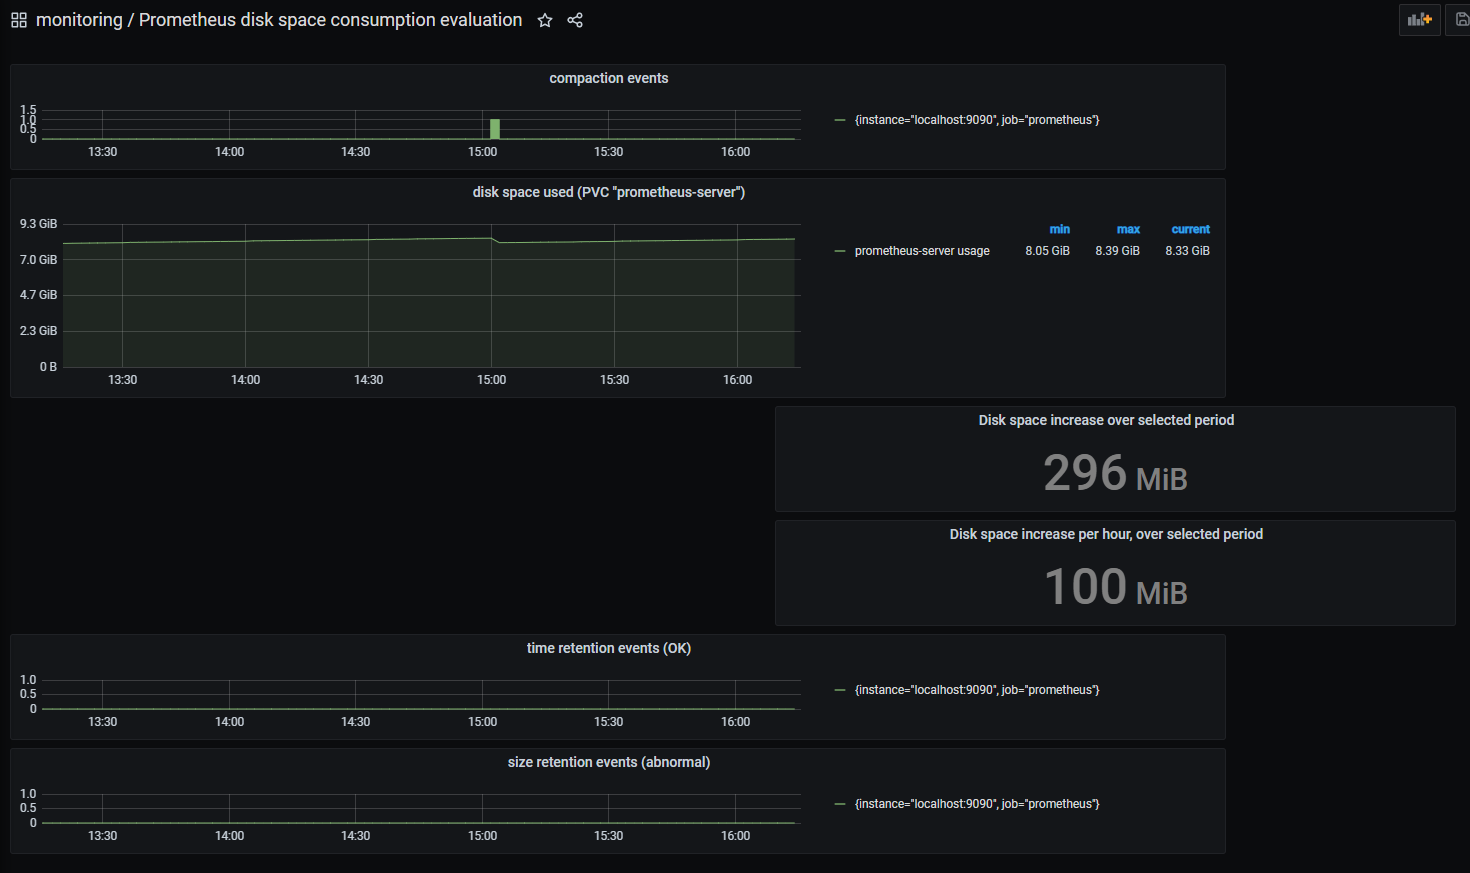
Dashboard to evaluate the disk space usage of Prometheus data, when deployed in a Kubernetes cluster.
This dashboard can be useful when evaluating the disk space usage of Prometheus data, when deployed in a Kubernetes cluster.
It correlates the disk usage of the persistent volume with prometheus events: compaction, size/time retention.
It shows:
- disk space used on the persistent volume (reported by the metric "kubelet_volume_stats_used_bytes" published by kubelet)
- compaction events (reported by the metric "prometheus_tsdb_compactions_total" published by Prometheus)
- time retention events
- size retention events
Data source config
Collector config:
Upload an updated version of an exported dashboard.json file from Grafana
| Revision | Description | Created | |
|---|---|---|---|
| Download |
Metrics Endpoint (Prometheus)
Easily monitor any Prometheus-compatible and publicly accessible metrics URL with Grafana Cloud's out-of-the-box monitoring solution.
Learn more
