Prometheus_server
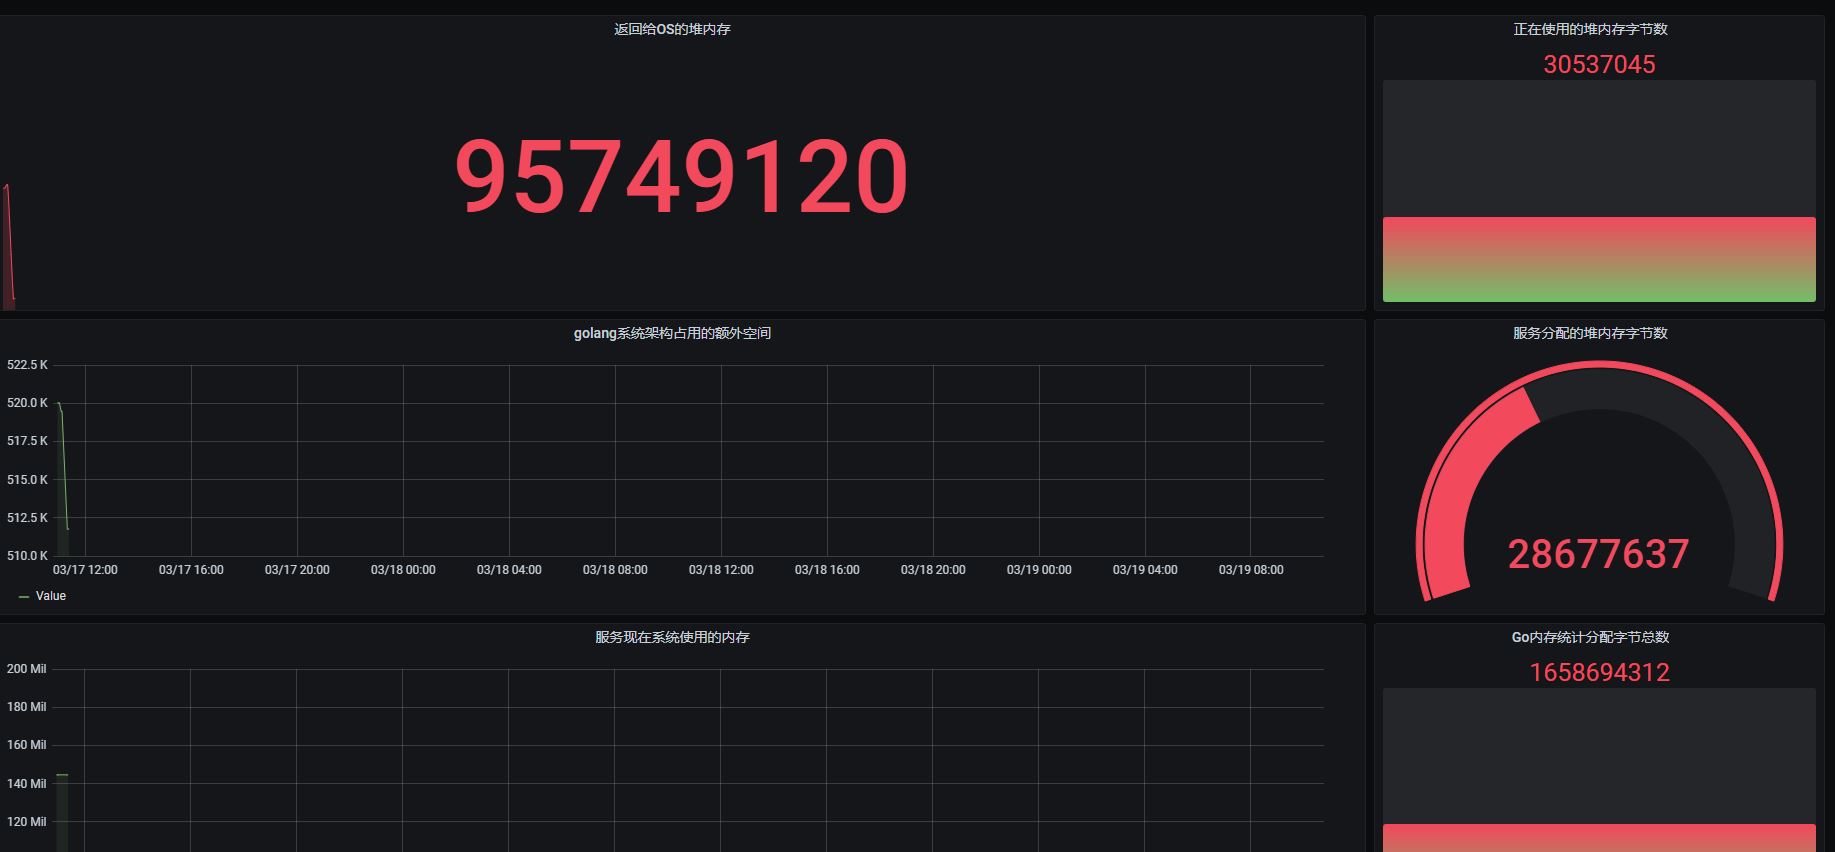
Based on promql query language A total of 16 monitoring items In the original version, there are only monitoring items at present, and there are no alarm and other strategies. Later, it will be gradually improved and increased, only suitable for Prometheus itself (because all query languages are go.xxxx (beginning) Currently, it's version 1 基于PromQL查询语言编写. 一共16个监控项目 最初的版本,目前暂时只有监控项,没有告警等其它策略。 后期会逐渐改进并且增加,仅仅适合Prometheus本身(因为所有的查询语言都是go.xxxx开始的) 目前暂时定为版本1.0 https://www.jianshu.com/p/ab4fcd17ca03
Data source config
Collector config:
Upload an updated version of an exported dashboard.json file from Grafana
| Revision | Description | Created | |
|---|---|---|---|
| Download |

