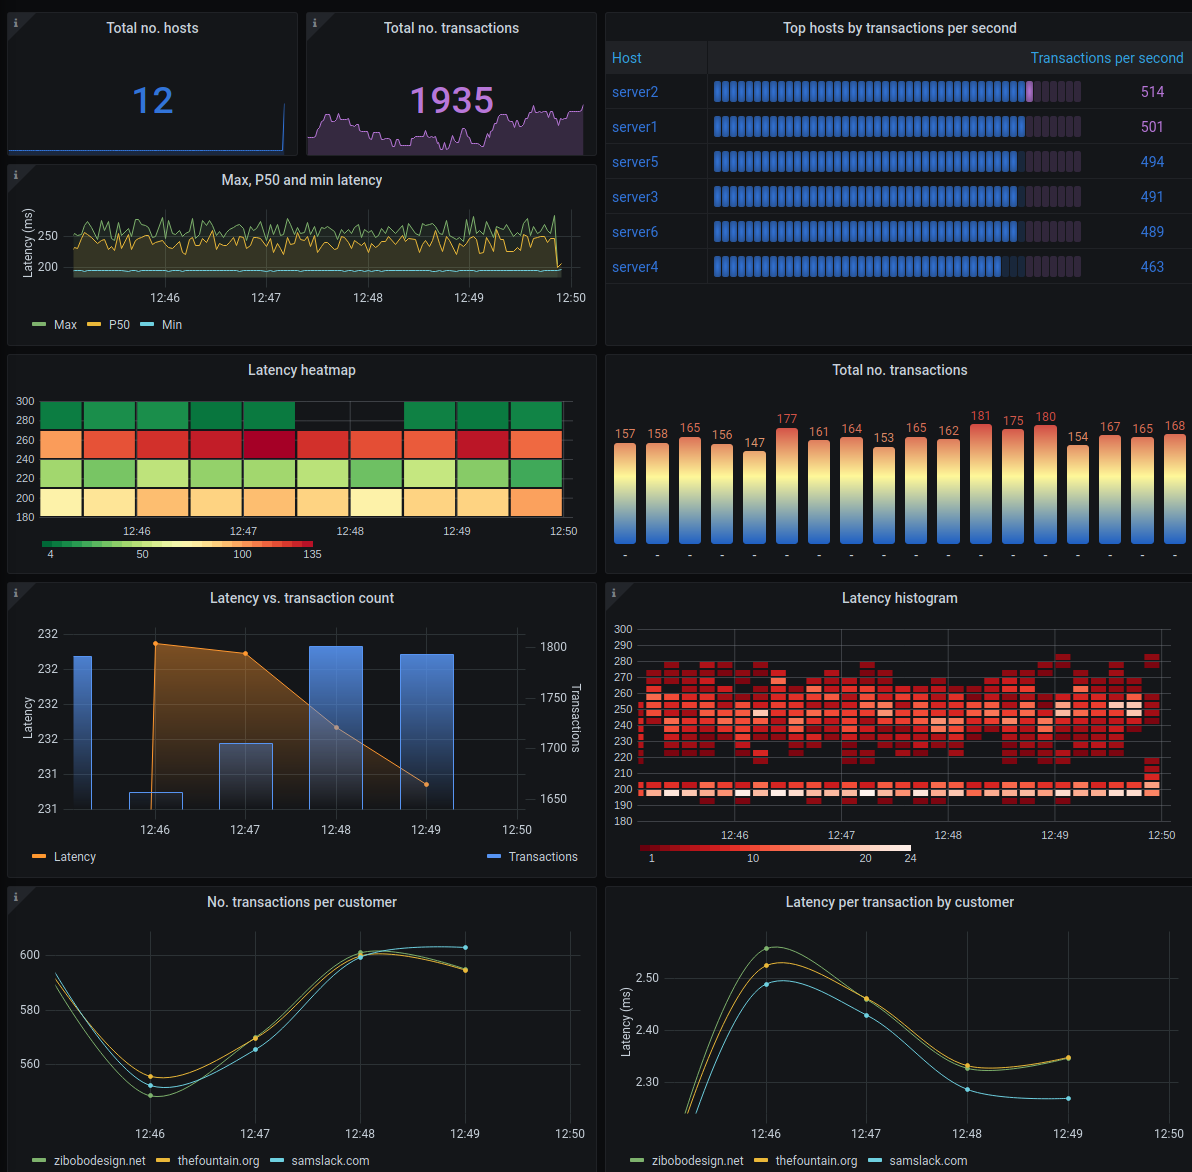
Splunk Infrastructure Monitoring / SignalFX Sample Data
A remake of the stock "Sample Charts (Sample Data)" dashboard on signalfx.com SignalFX is now known as Splunk Infrastructure Monitoring.
This dashboard utilizes the Grafana Enterprise plugin for Splunk Infrastructure Monitoring.
You can read more about the plugin on the plugin page.
This is a Grafana port of the dashboard found in the Splunk Infrastructure Monitoring / SignalFX dashboard named "Sample Data - Sample Charts"
It should work with the sample data in every Splunk Infrastructure Monitoring / SignalFX account and helps to illustrate how one could recreate their existing dashboards in Grafana.
Data source config
Collector config:
Upload an updated version of an exported dashboard.json file from Grafana
| Revision | Description | Created | |
|---|---|---|---|
| Download |
Splunk
Get out-of-the-box Splunk visualizations and easily query and correlate your data in Grafana.
Learn more