Cassandra Dashboard by ORAMAD
https://github.com/Sarma1807/Prometheus-Grafana-Cassandra
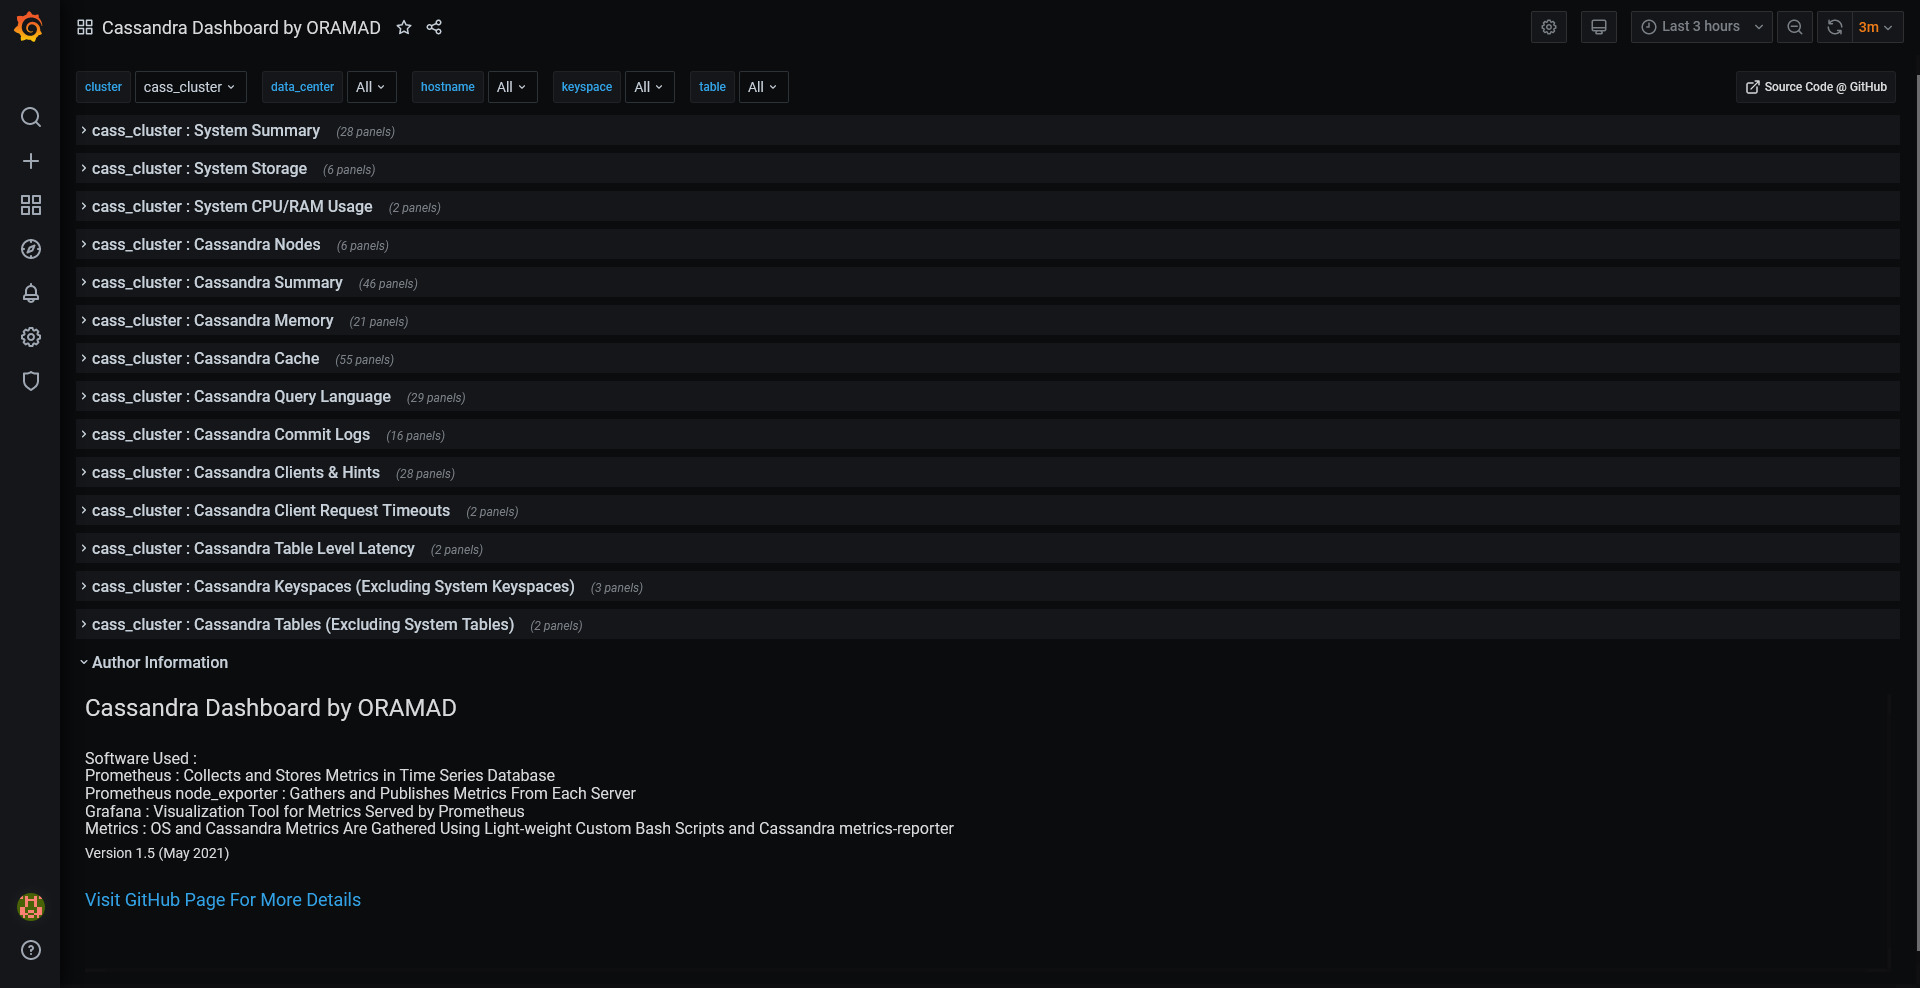
This dashboard contains several different sections to highlight the metrics for specific categories.
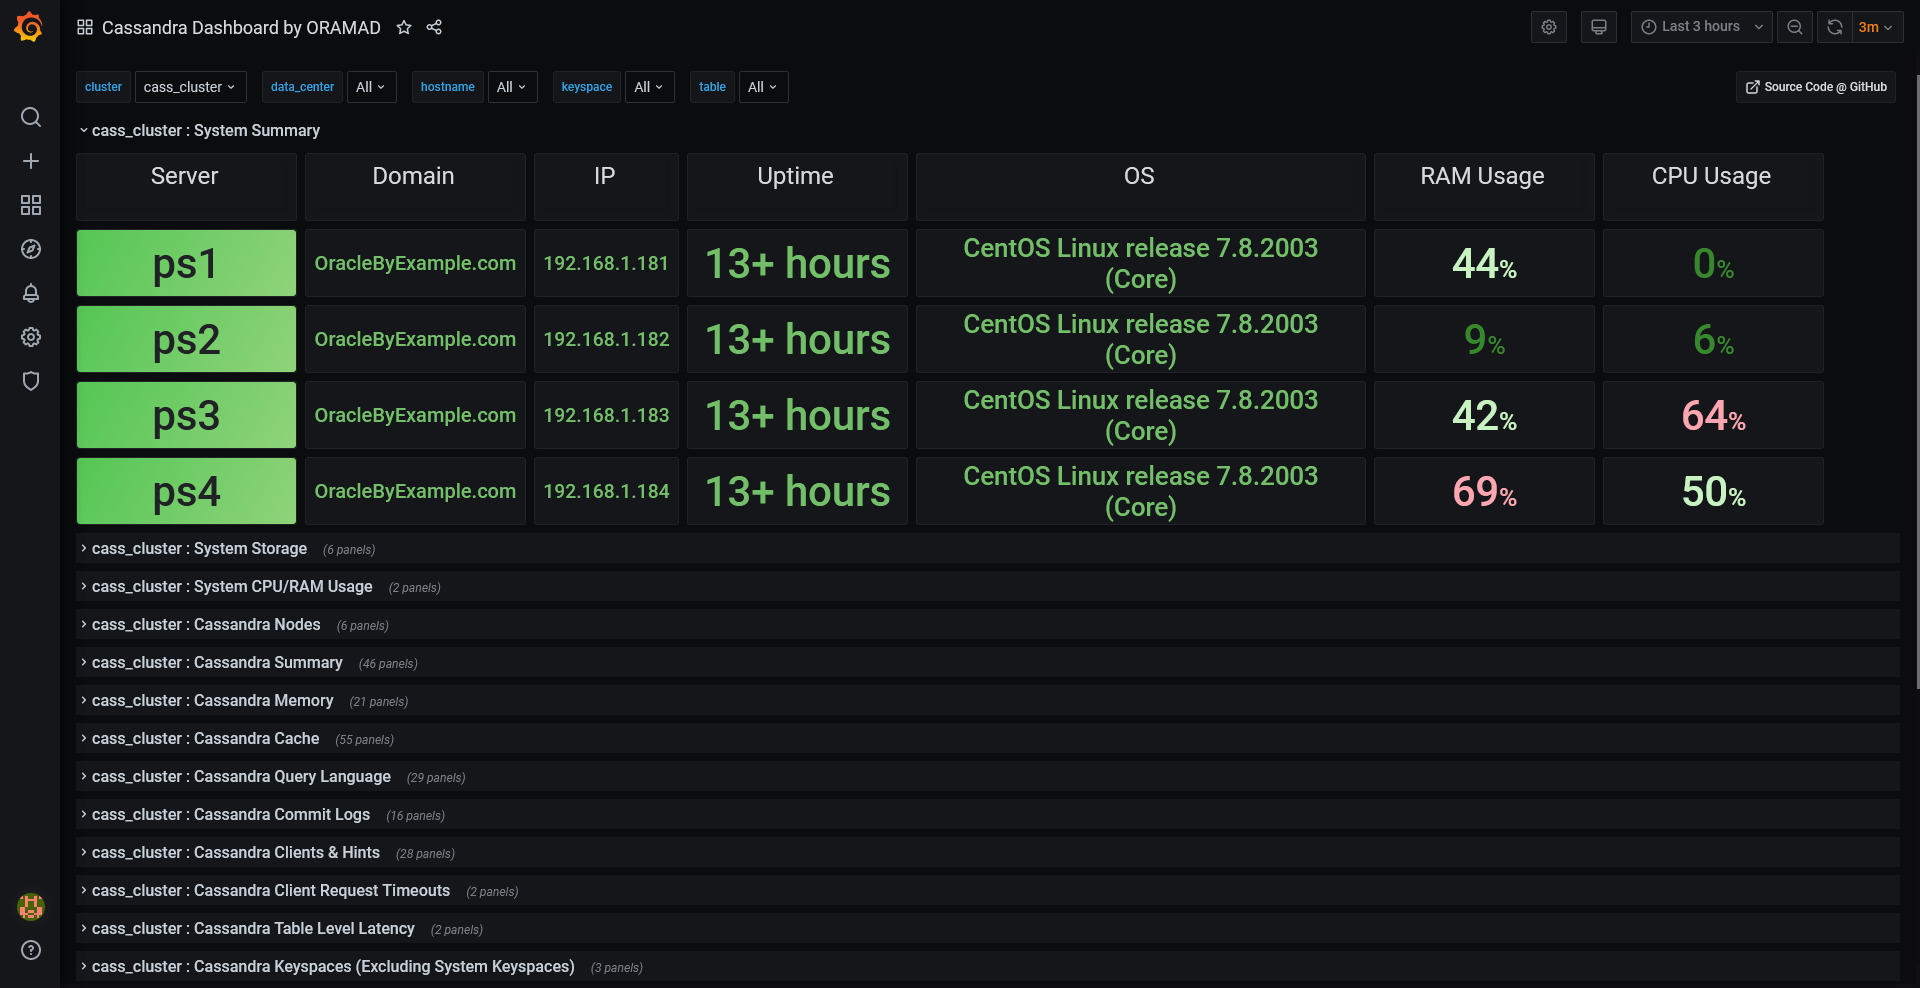
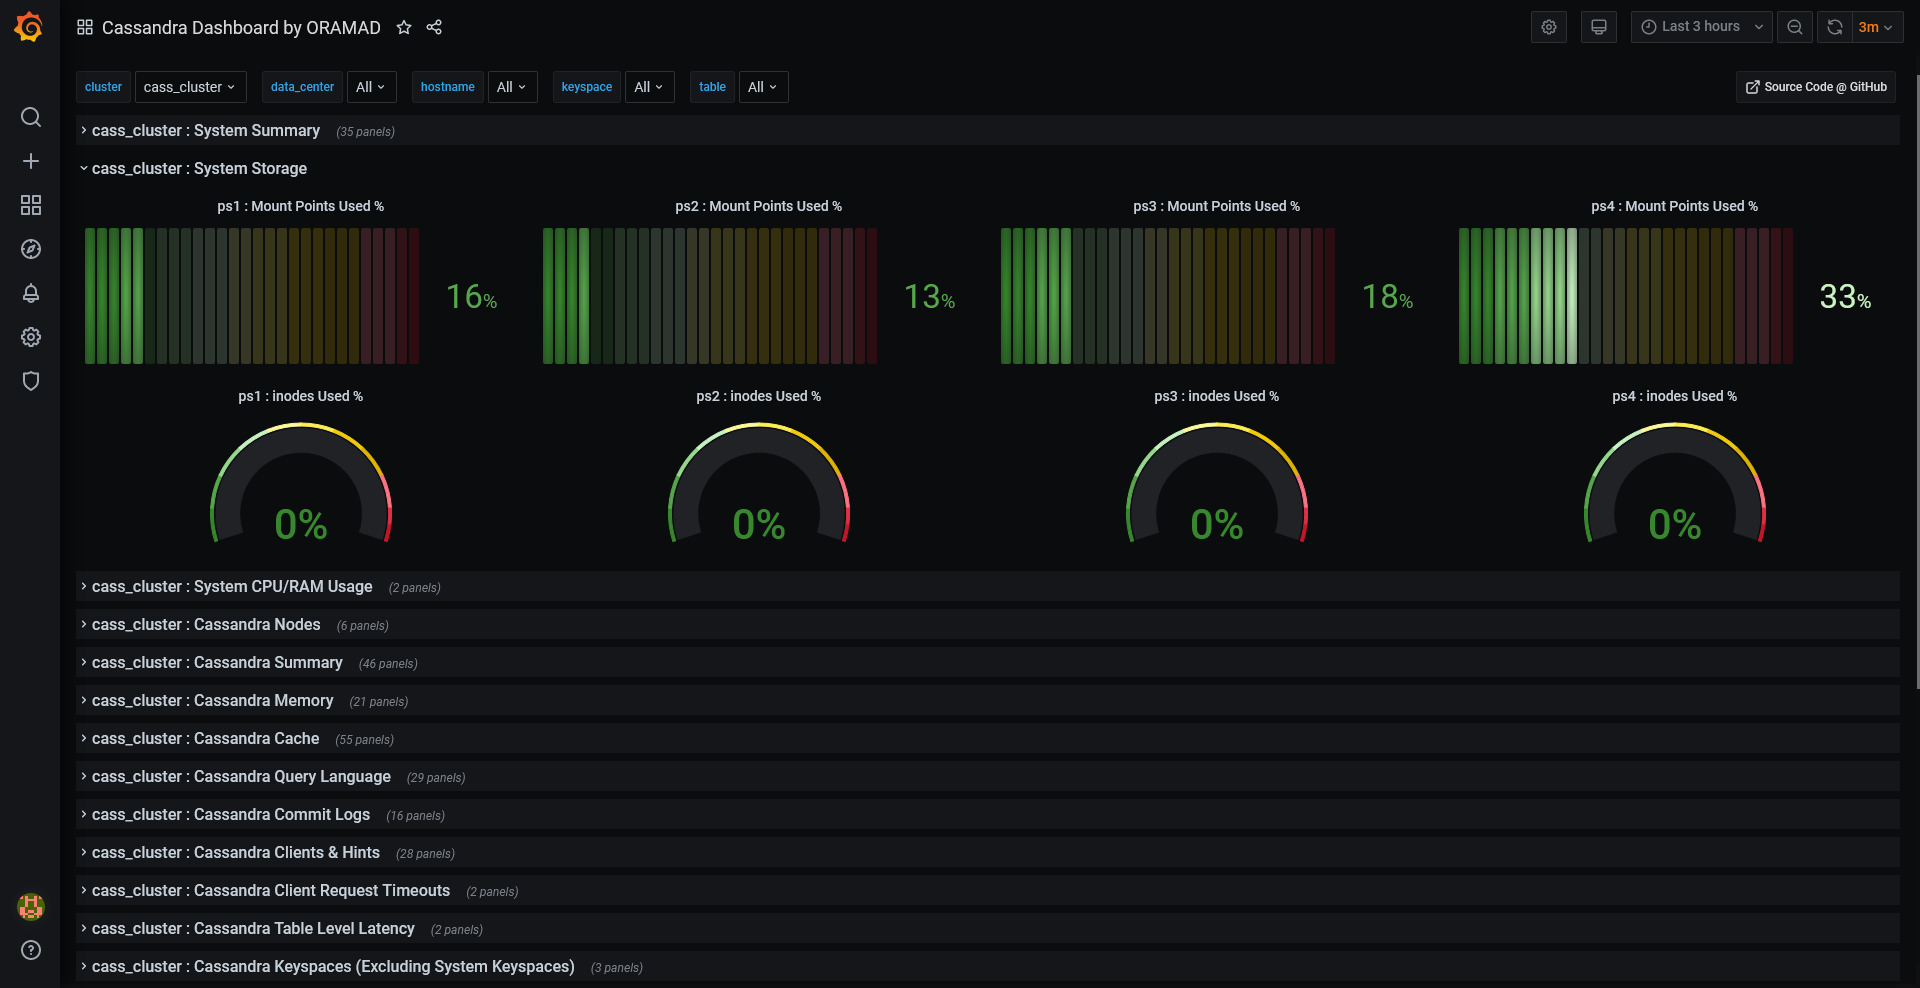
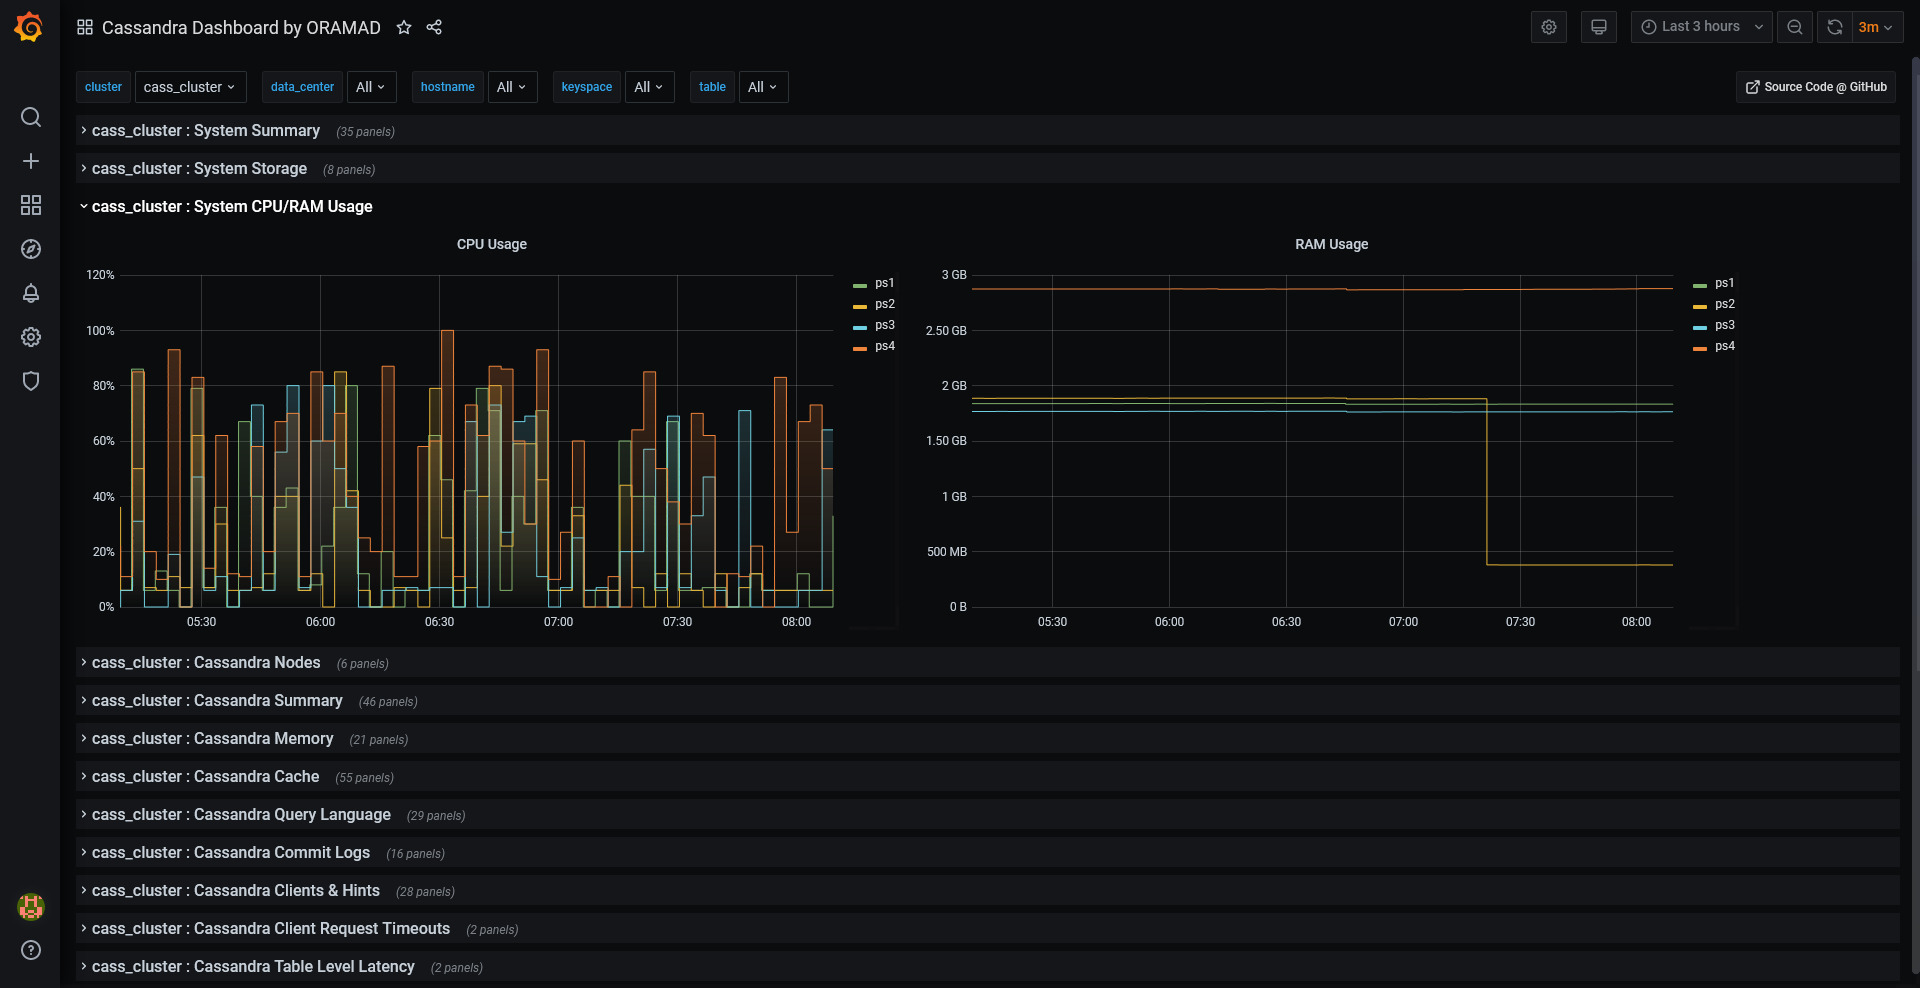
There are few dedicated sections for Server OS metrics ( OS Details/Storage/CPU/RAM Usage )
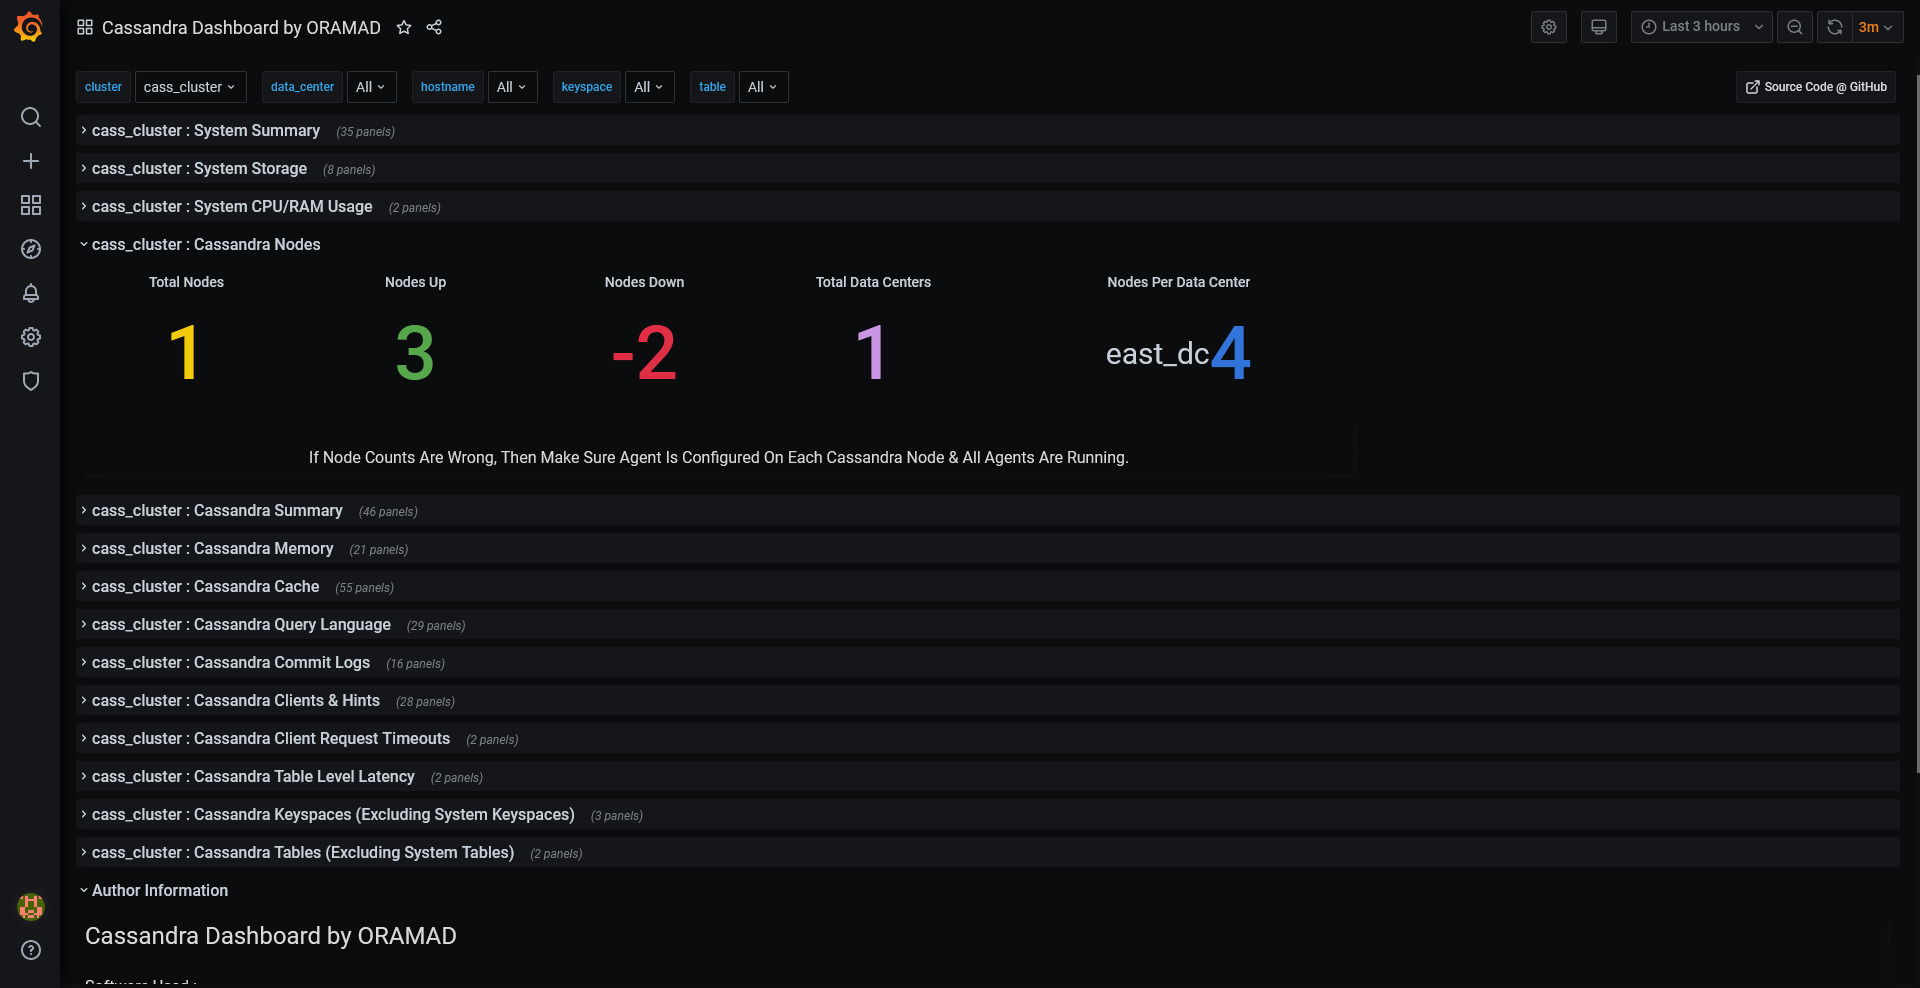
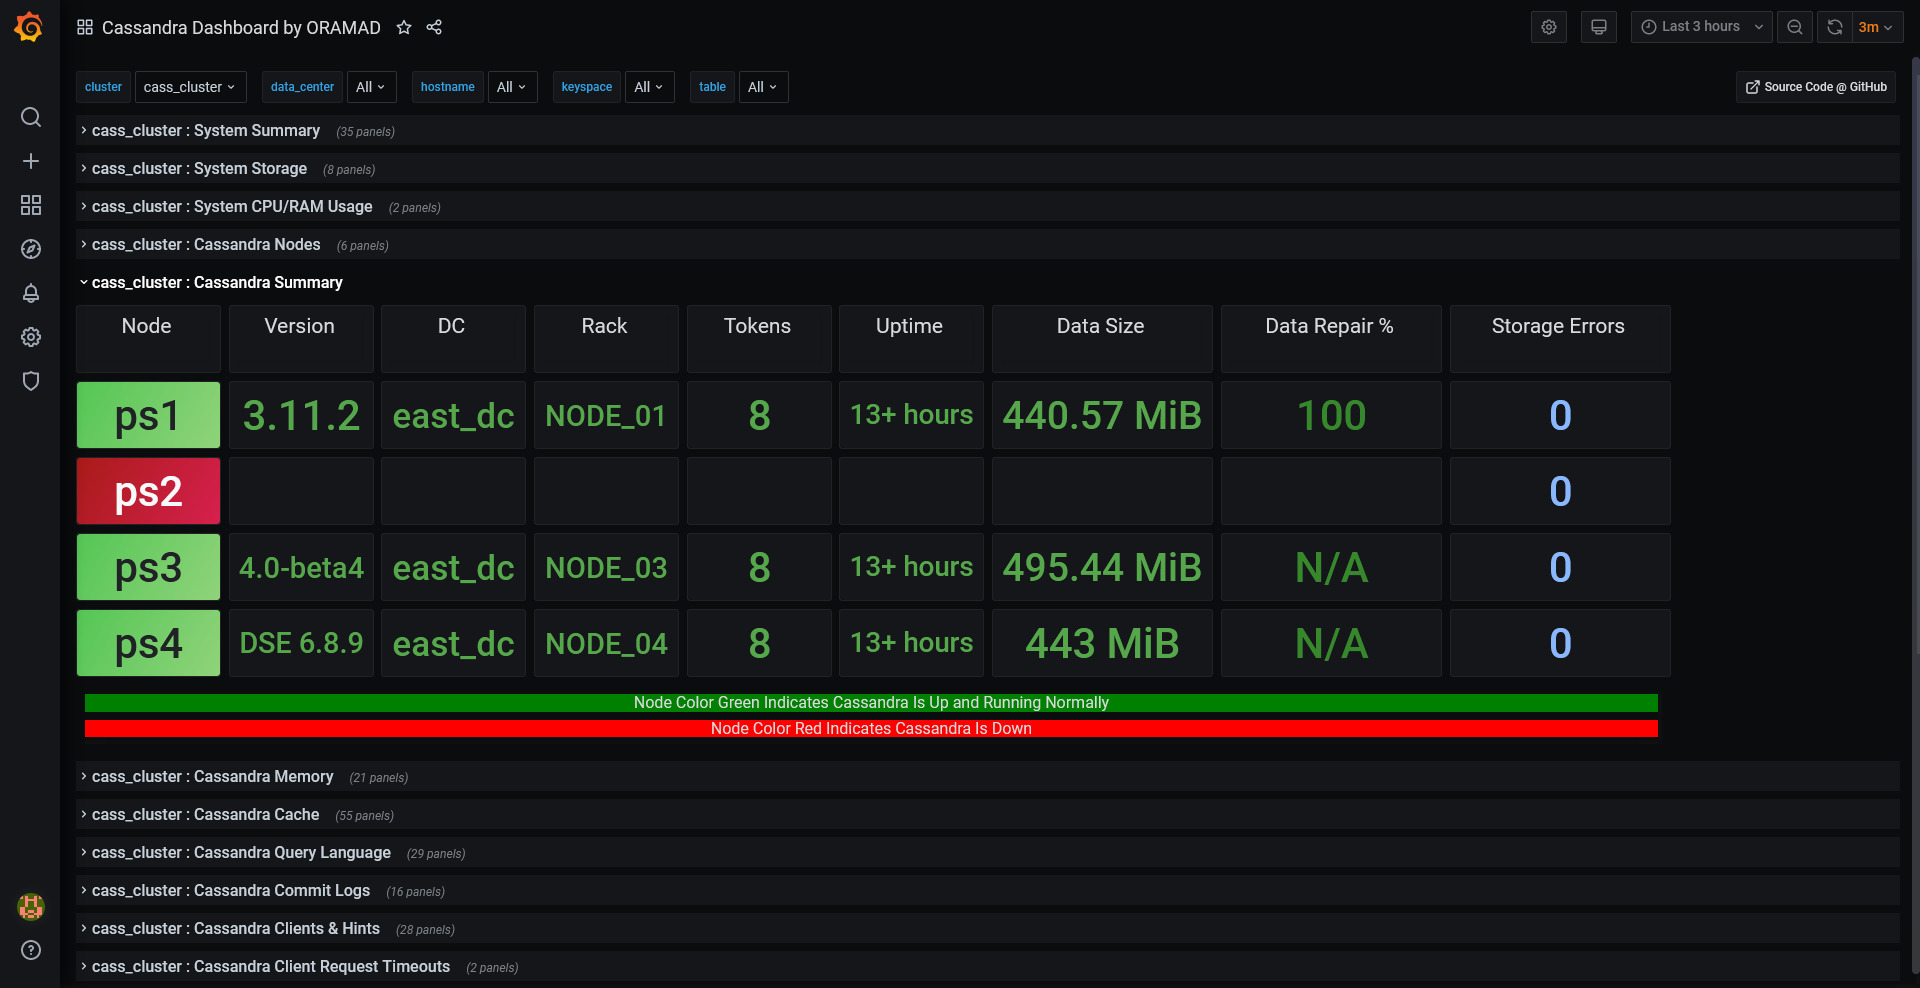
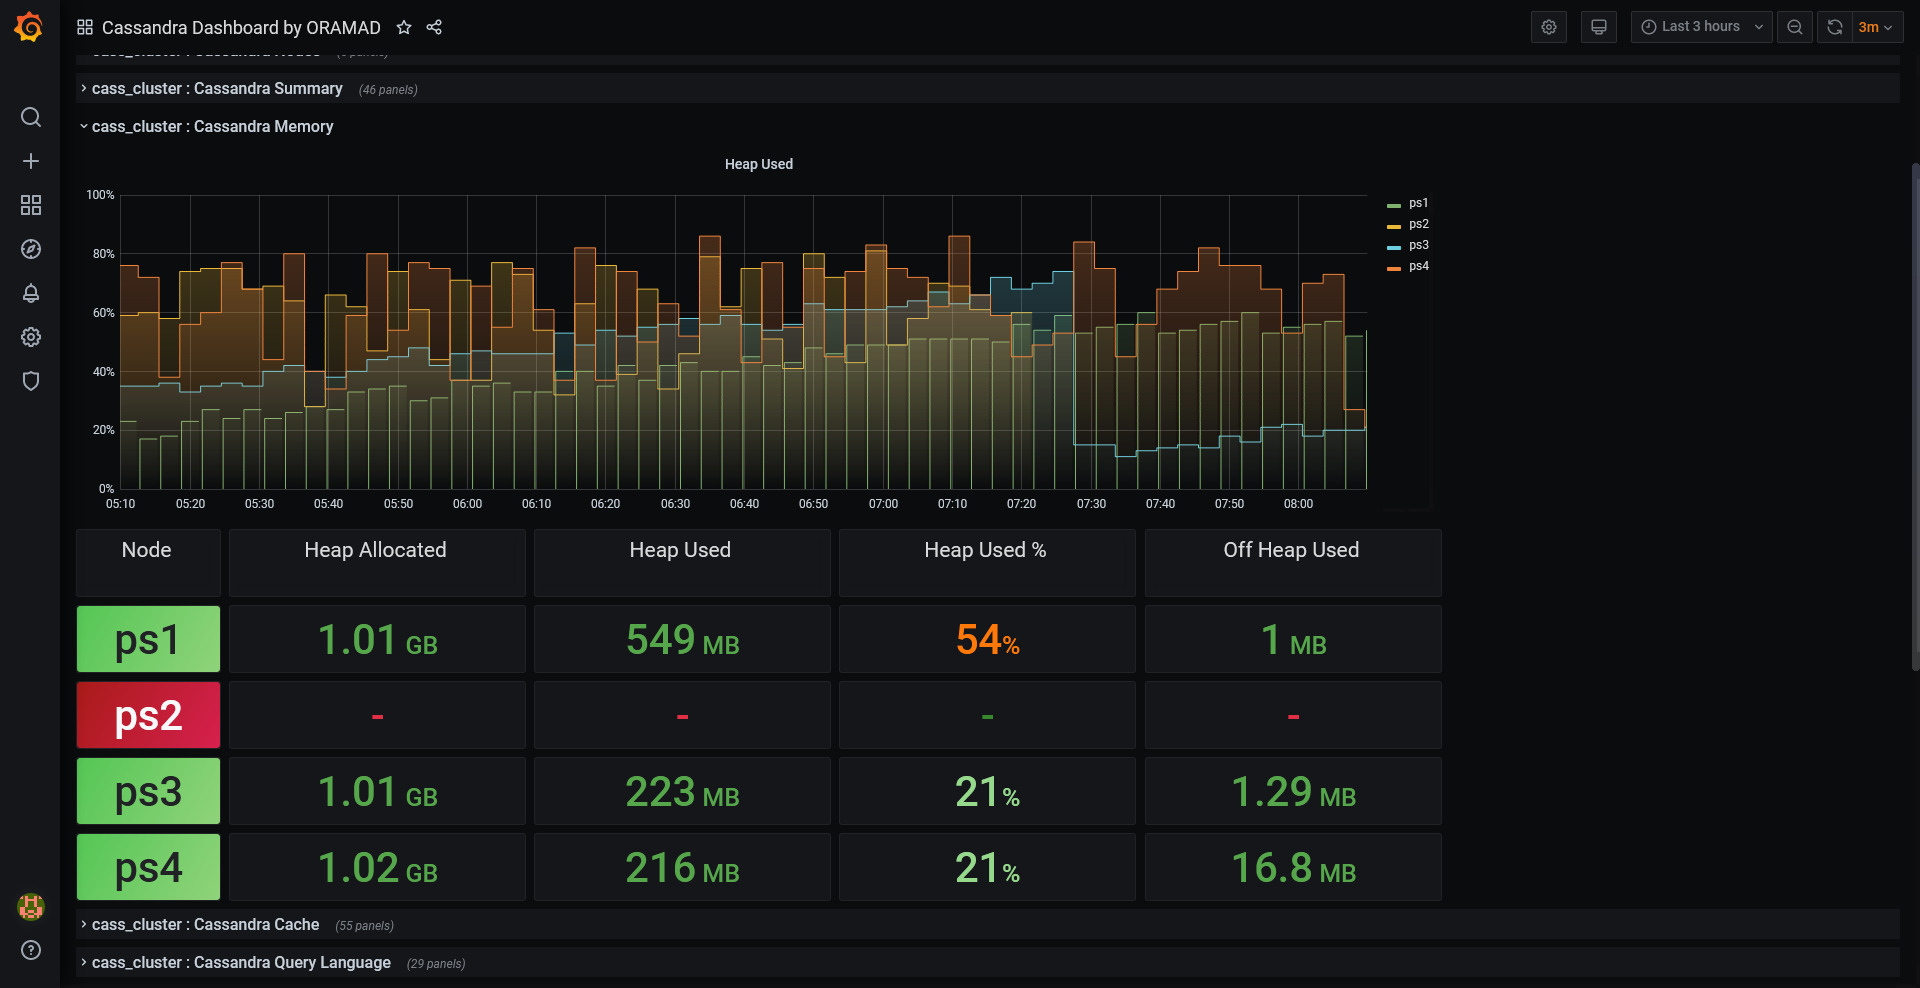
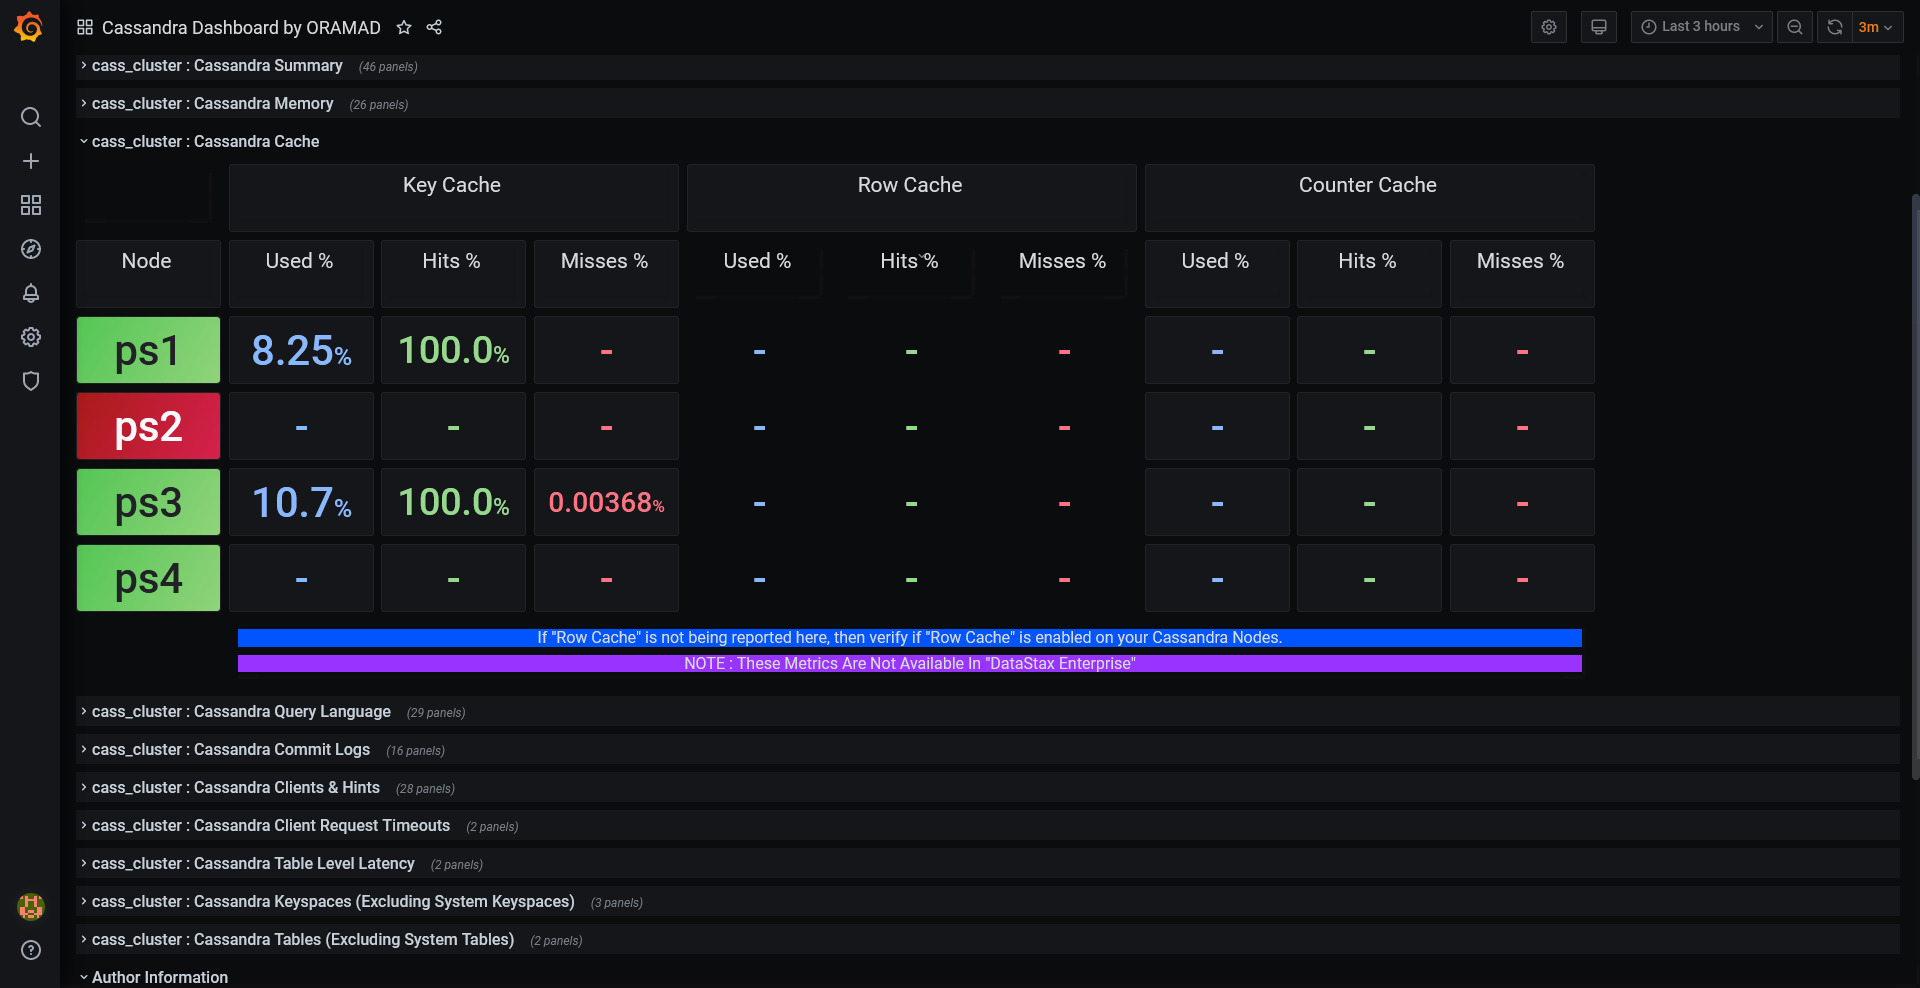
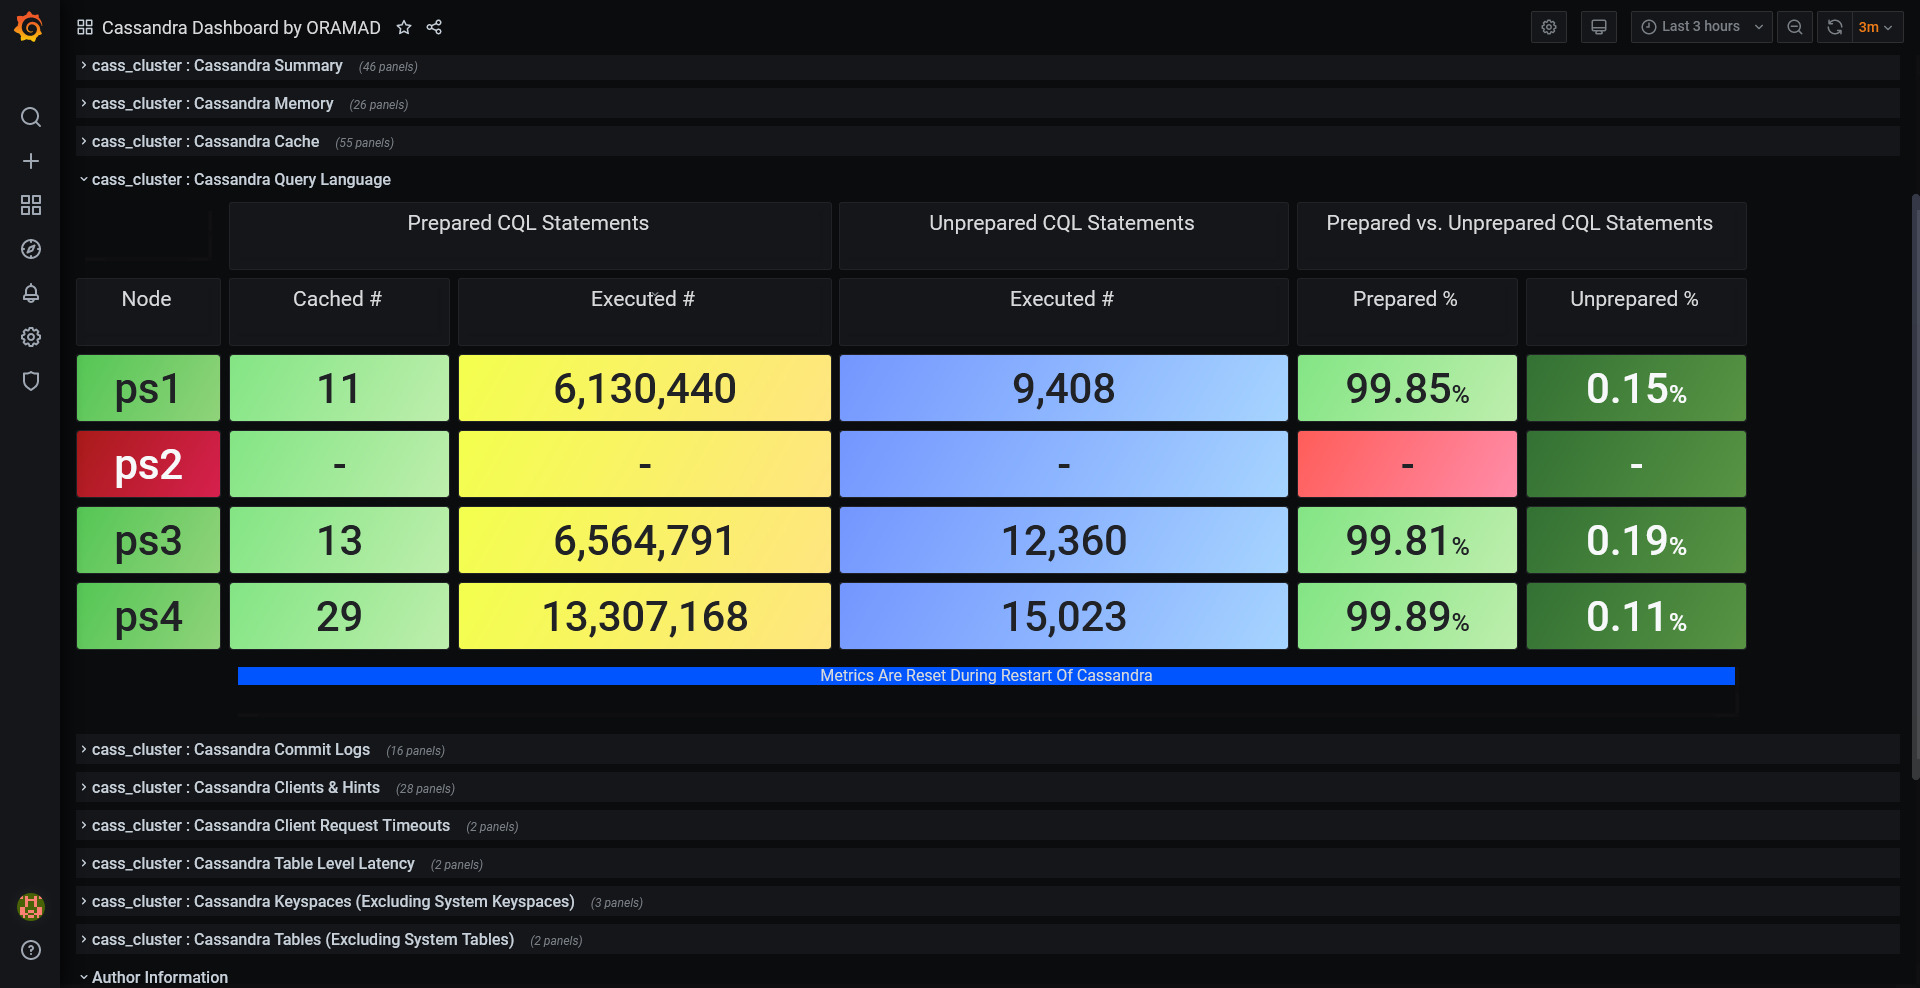
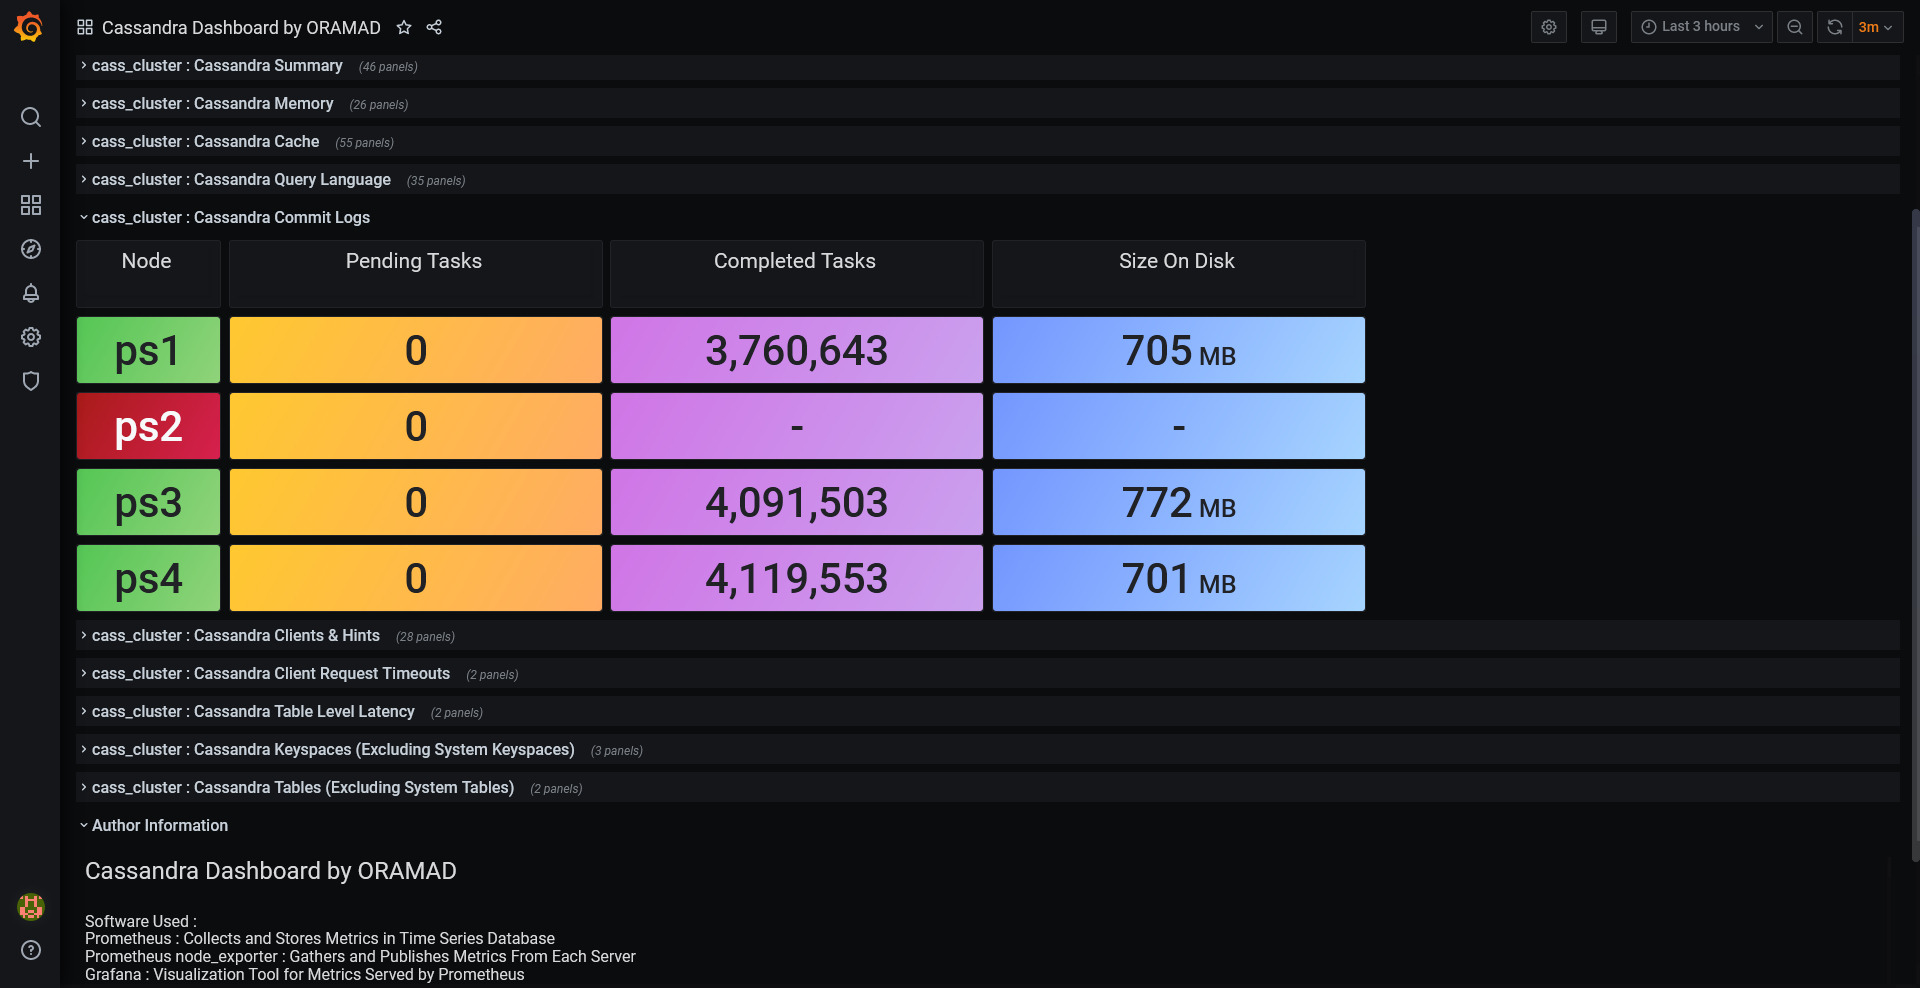
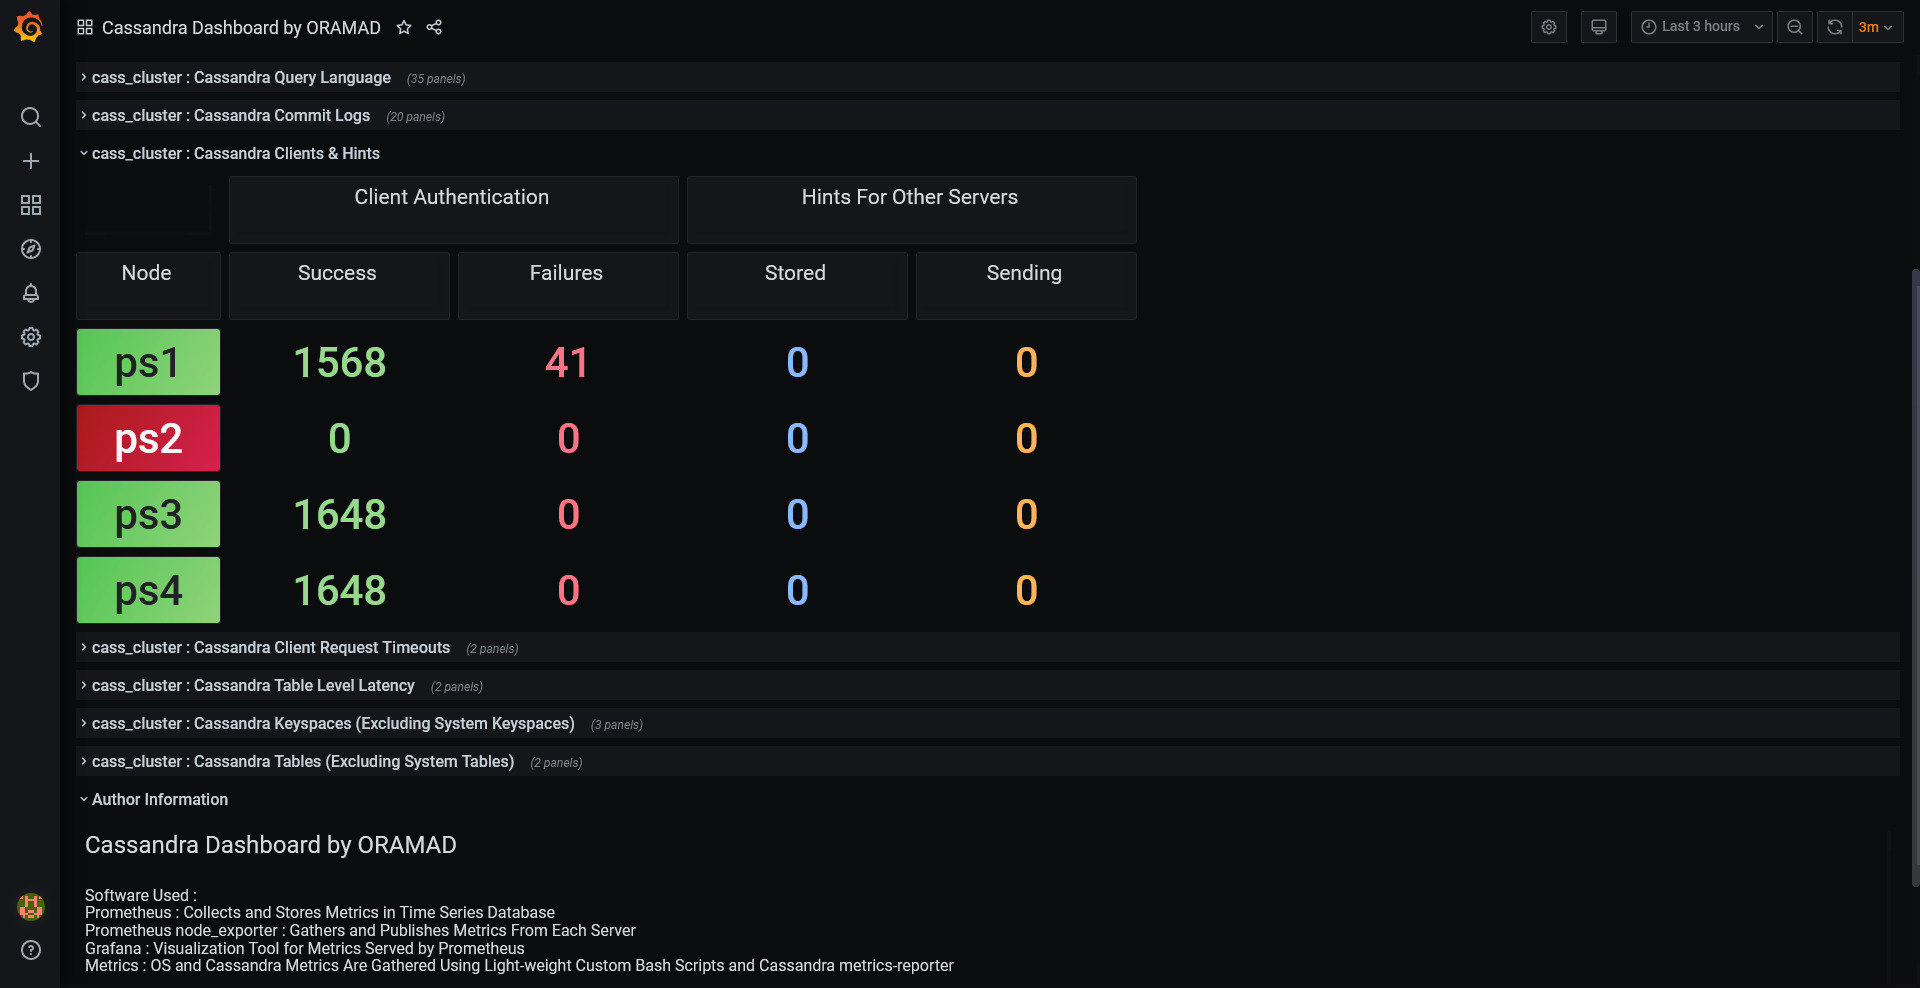
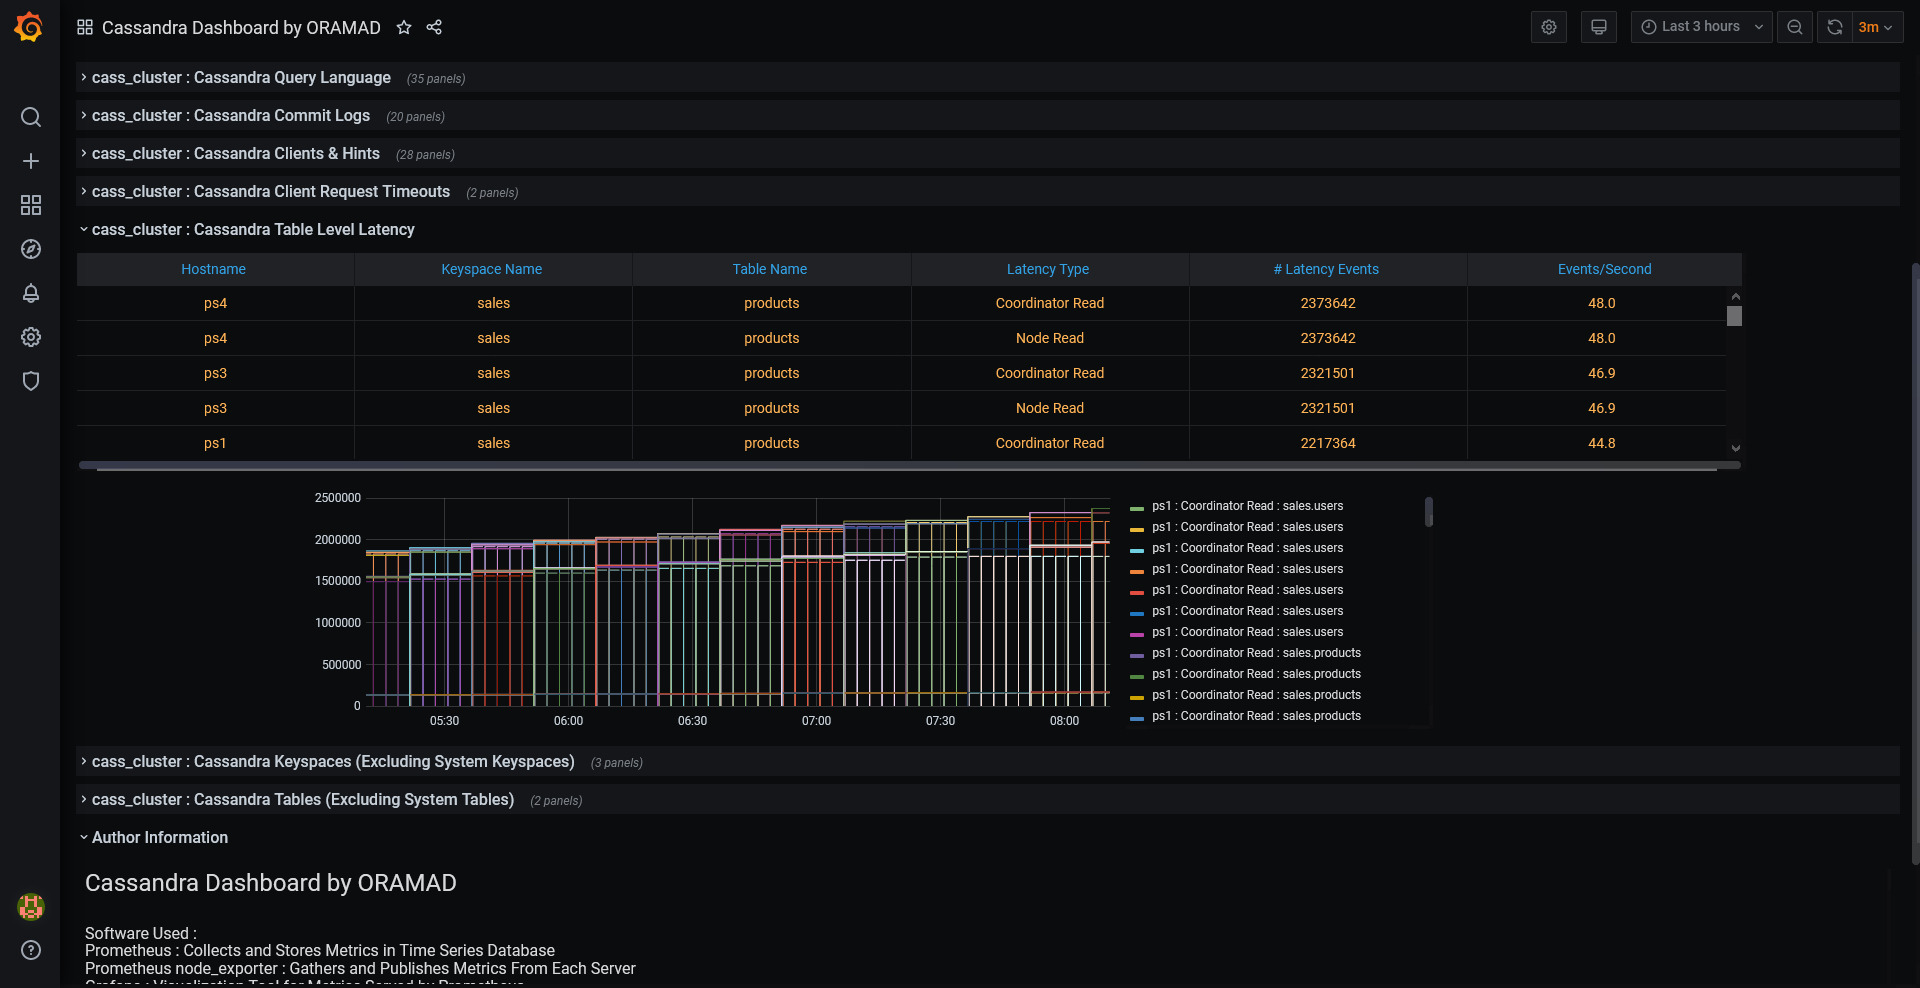
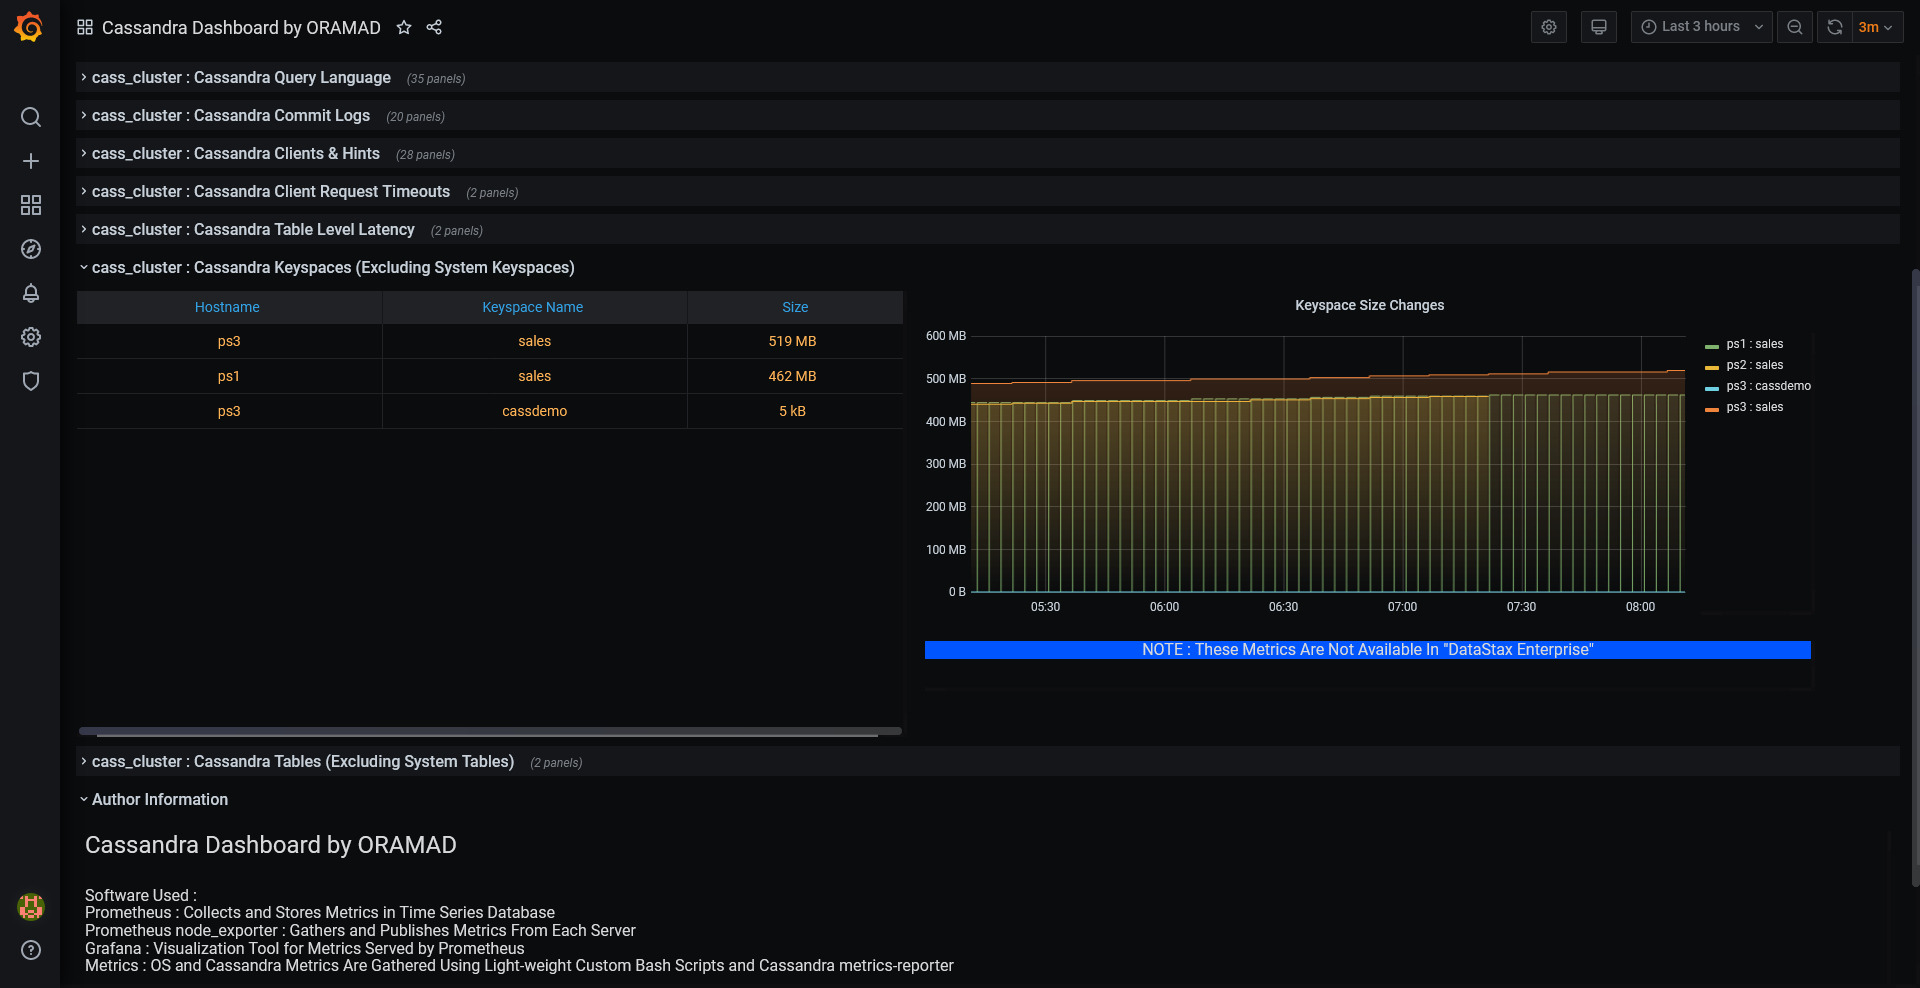
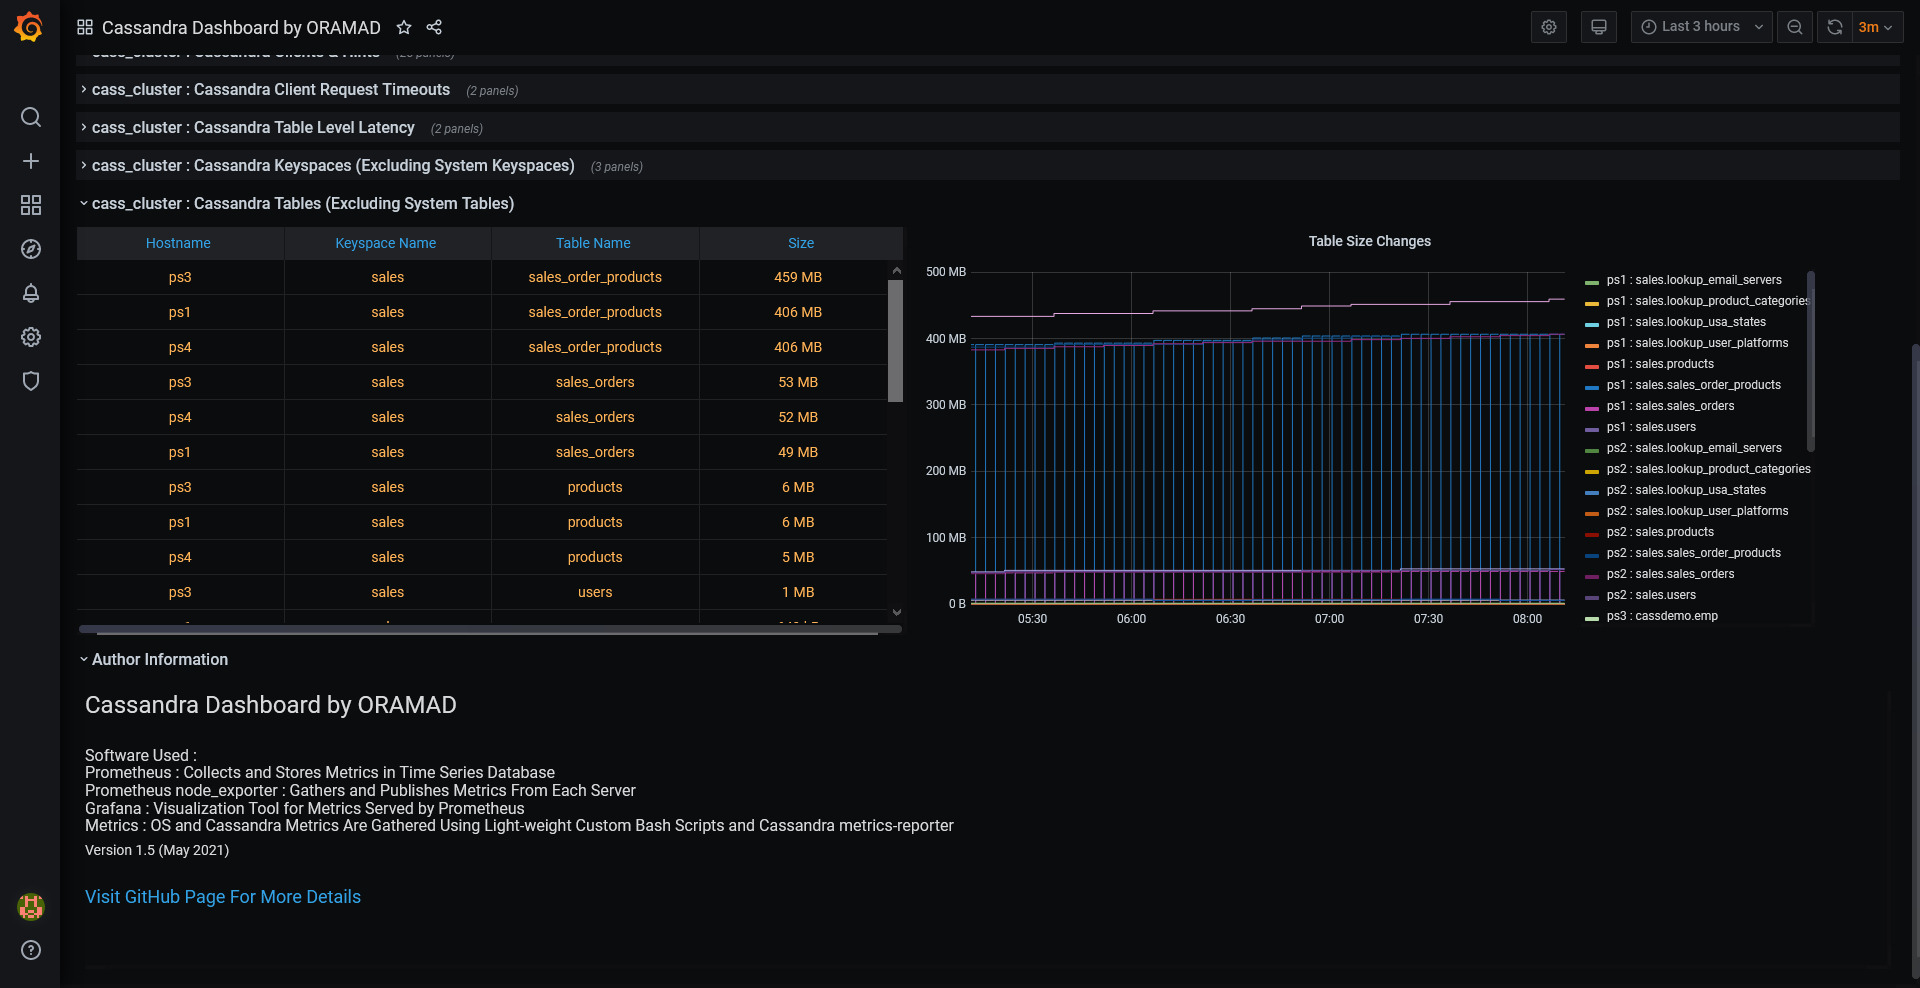
All remaining sections are for Cassandra metrics ( Cassandra Nodes Summary/Heap Usage/Cache/CQL/Commit Log Metrics/Clients/Hints/Request Timeouts/Latency Metrics/Size details at Keyspace Level and Table Level )
Dashboard also provides several filters ( cluster/data_center/hostname/keyspace/table ) and makes it very easy to monitor several Apache Cassandra clusters in one place.
Dashboard has been tested and working with Apache Cassandra 3.11.x / Apache Cassandra 4.x & DSE 6.8.x
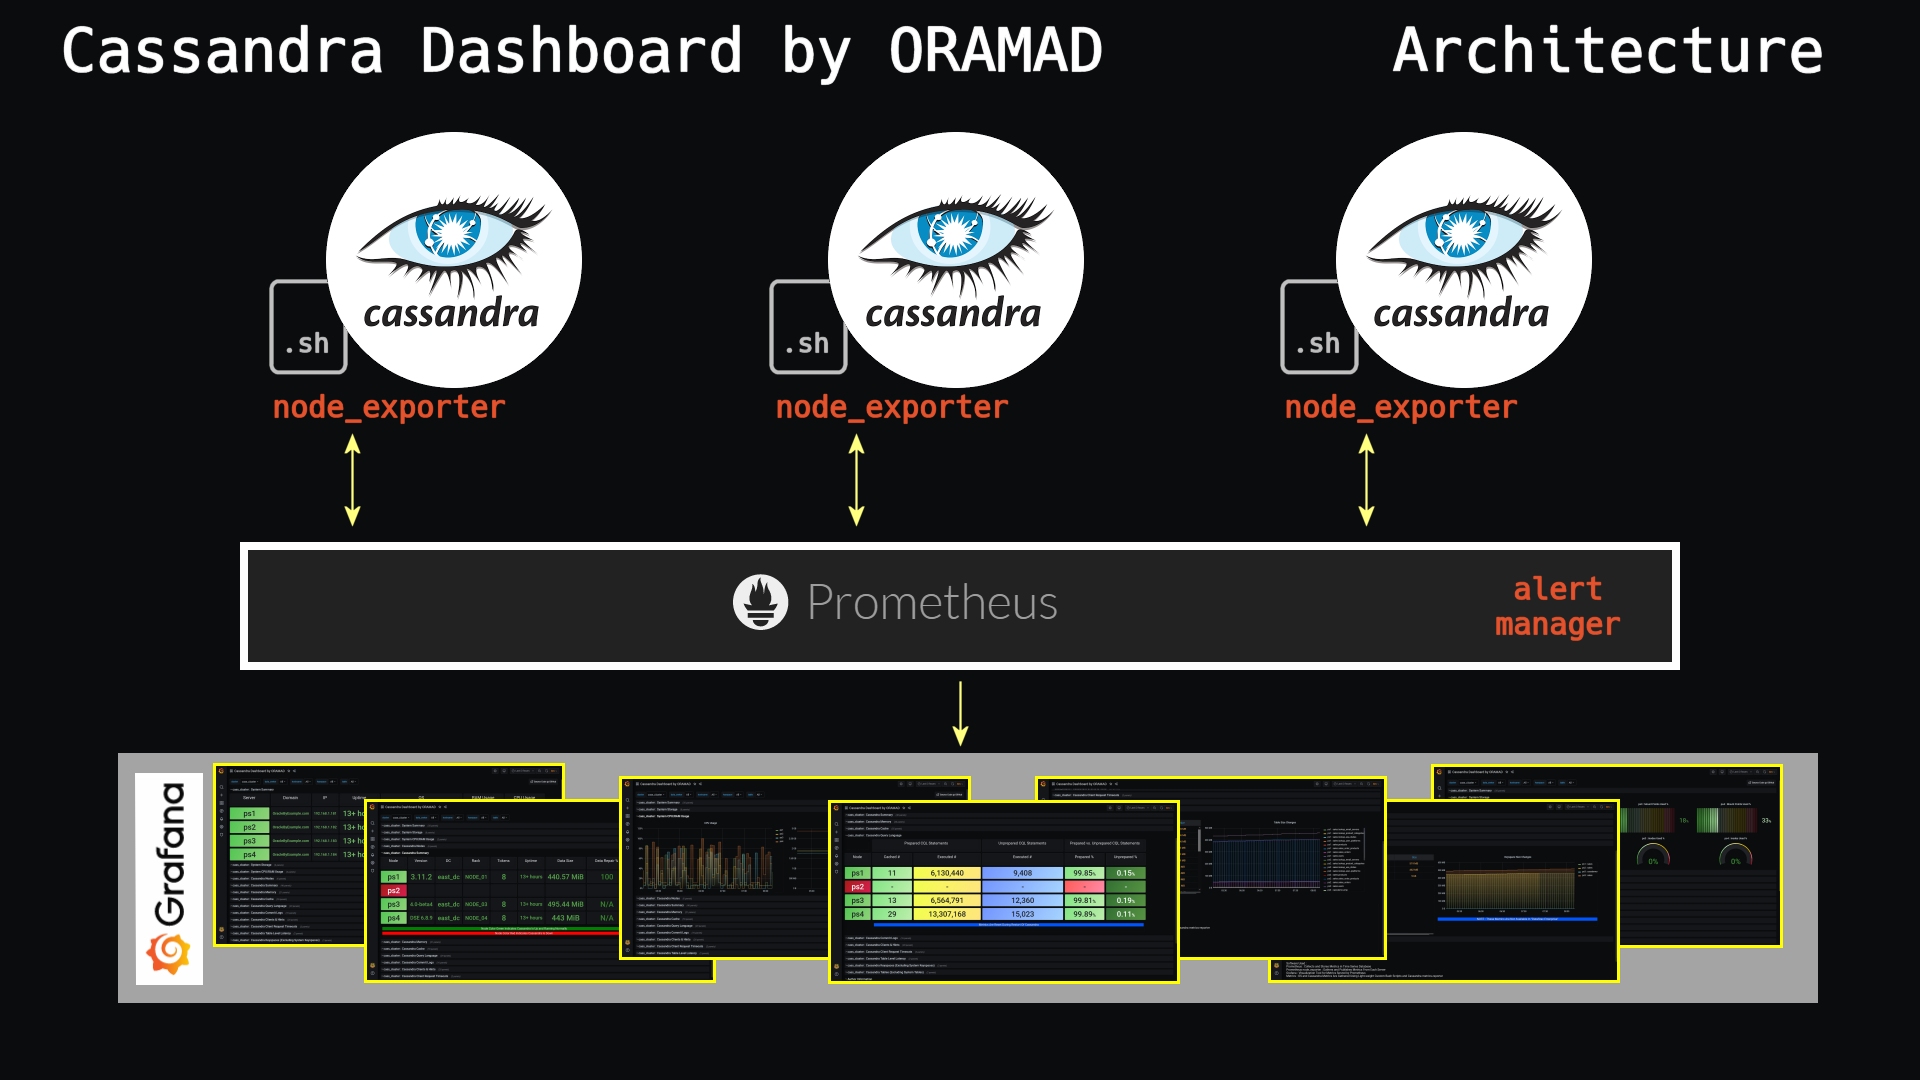
How Does It Work ?
Apache Cassandra's built in metrics-reporter module is used to extract and publish metrics to a text file on each Cassandra server. Easy to understand bash shell script converts this metrics file to Prometheus metrics format and they are exposed to Prometheus using node_exporter. As you know JMX configuration is complicated, changes to JMX configuration is NOT REQUIRED for this dashboard.
Periodically Prometheus will get the metrics from node_exporter and store them in its own Time-series database.
Grafana is used to read those metrics from Prometheus and display them on an easy to understand dashboard.
Step-by-step configuration and source code has been published at : https://github.com/Sarma1807/Prometheus-Grafana-Cassandra
Data source config
Collector config:
Upload an updated version of an exported dashboard.json file from Grafana
| Revision | Description | Created | |
|---|---|---|---|
| Download |
Apache Cassandra
Easily monitor Apache Cassandra, the popular open source NoSQL distributed database, with Grafana Cloud's out-of-the-box monitoring solution.
Learn more