
JmeterInflux
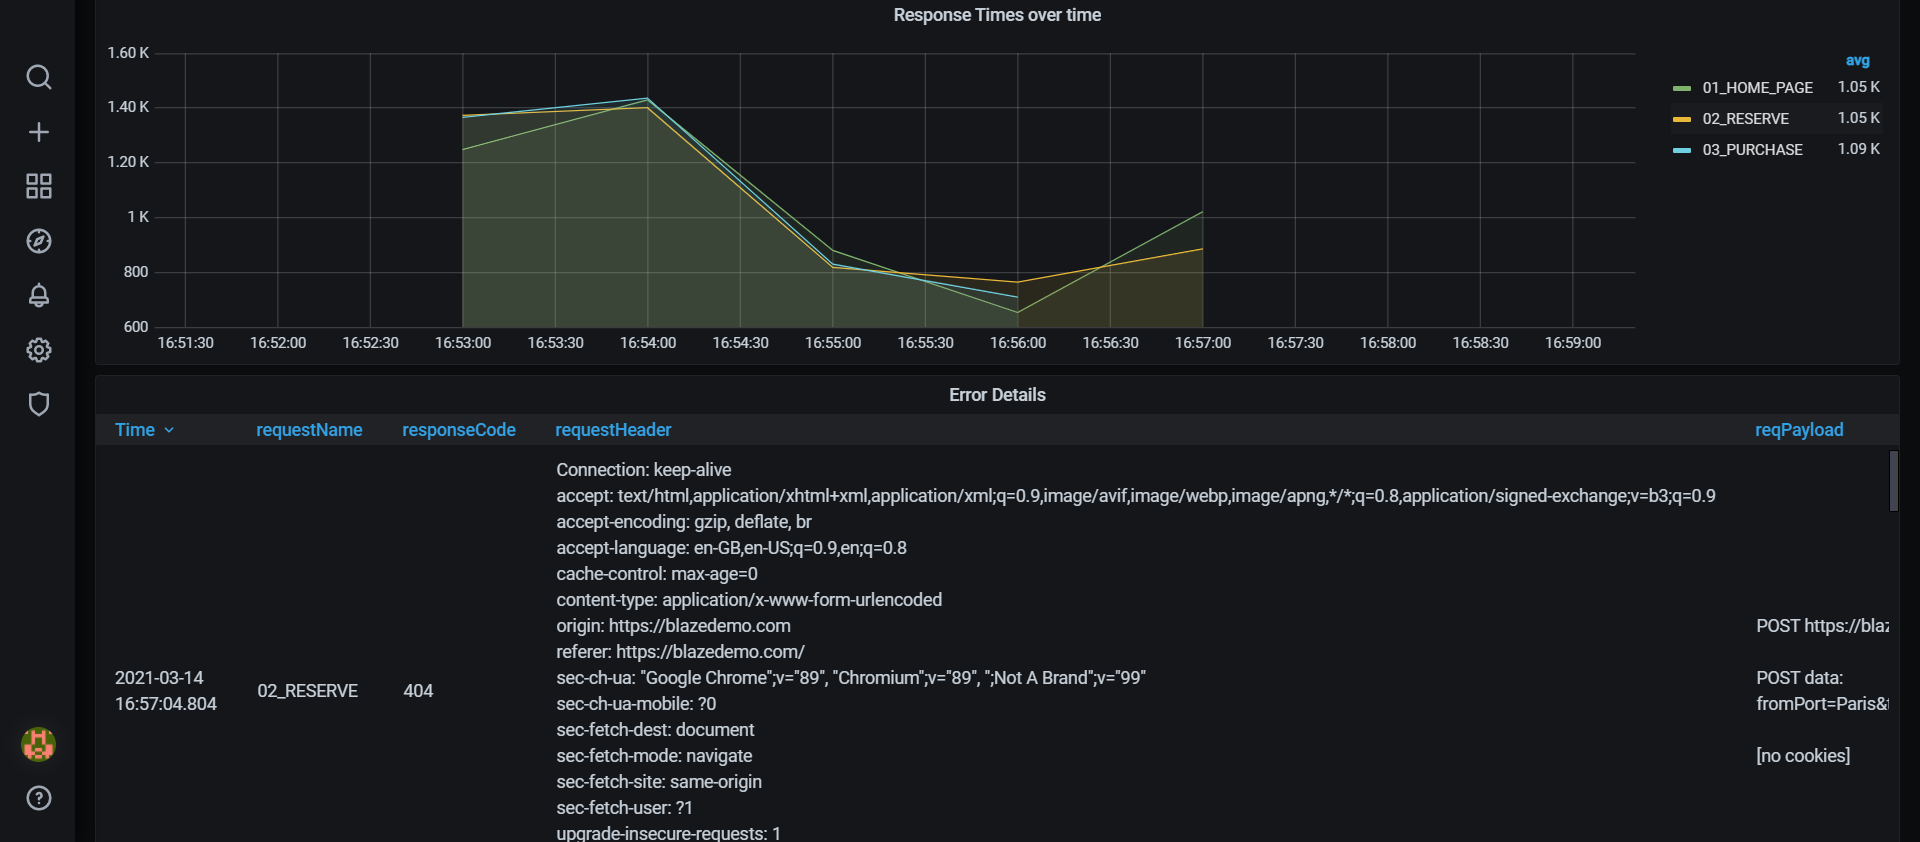
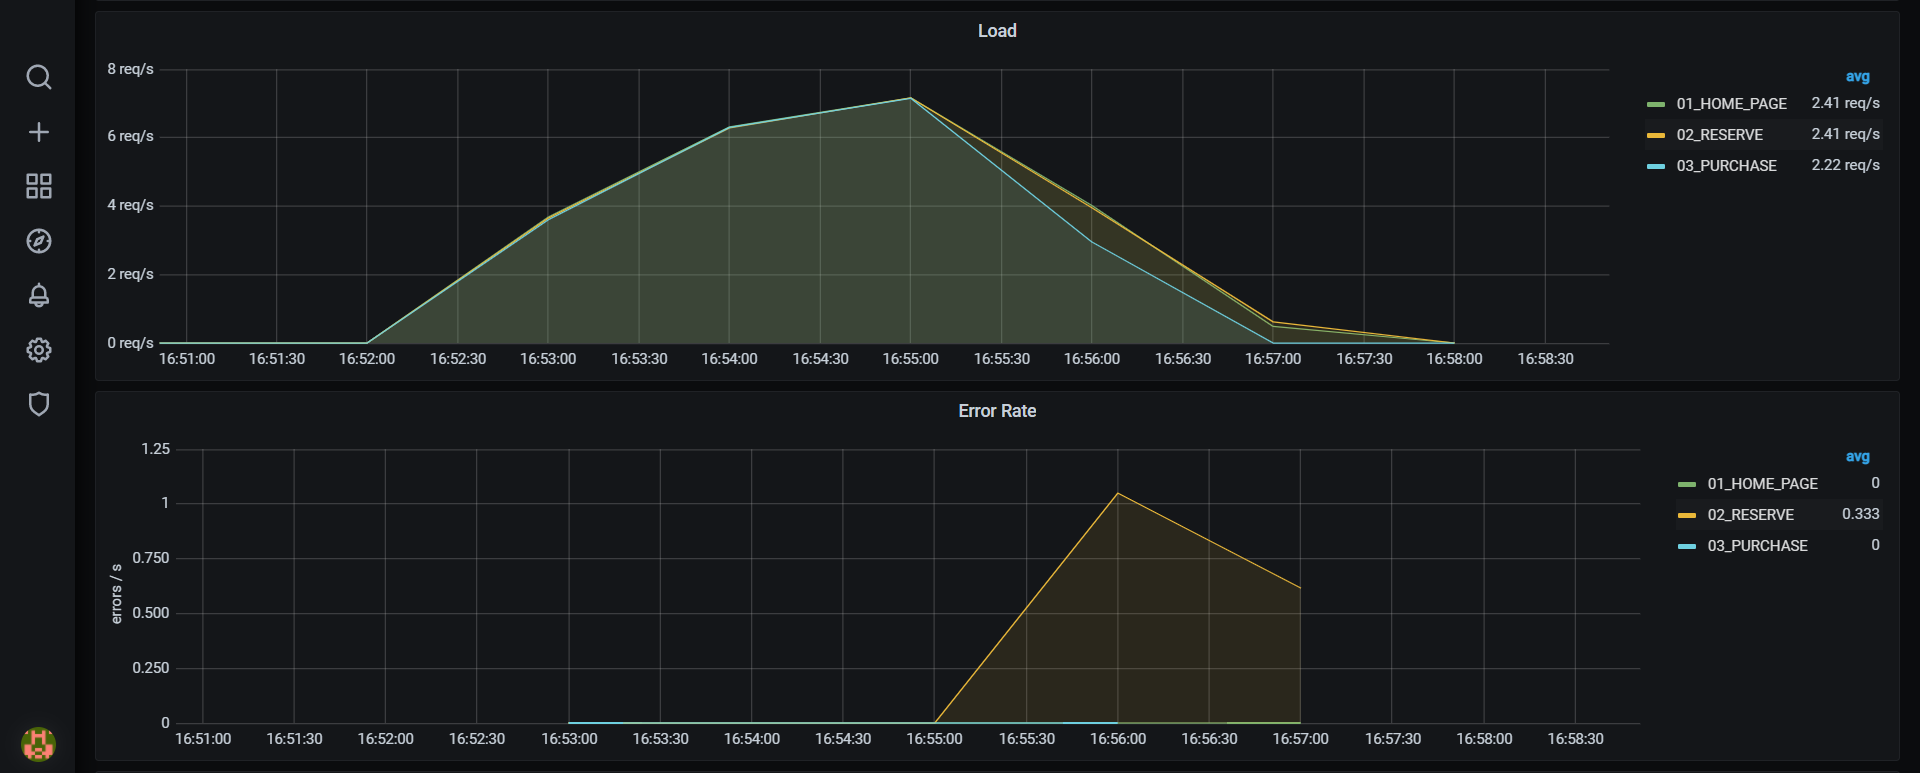
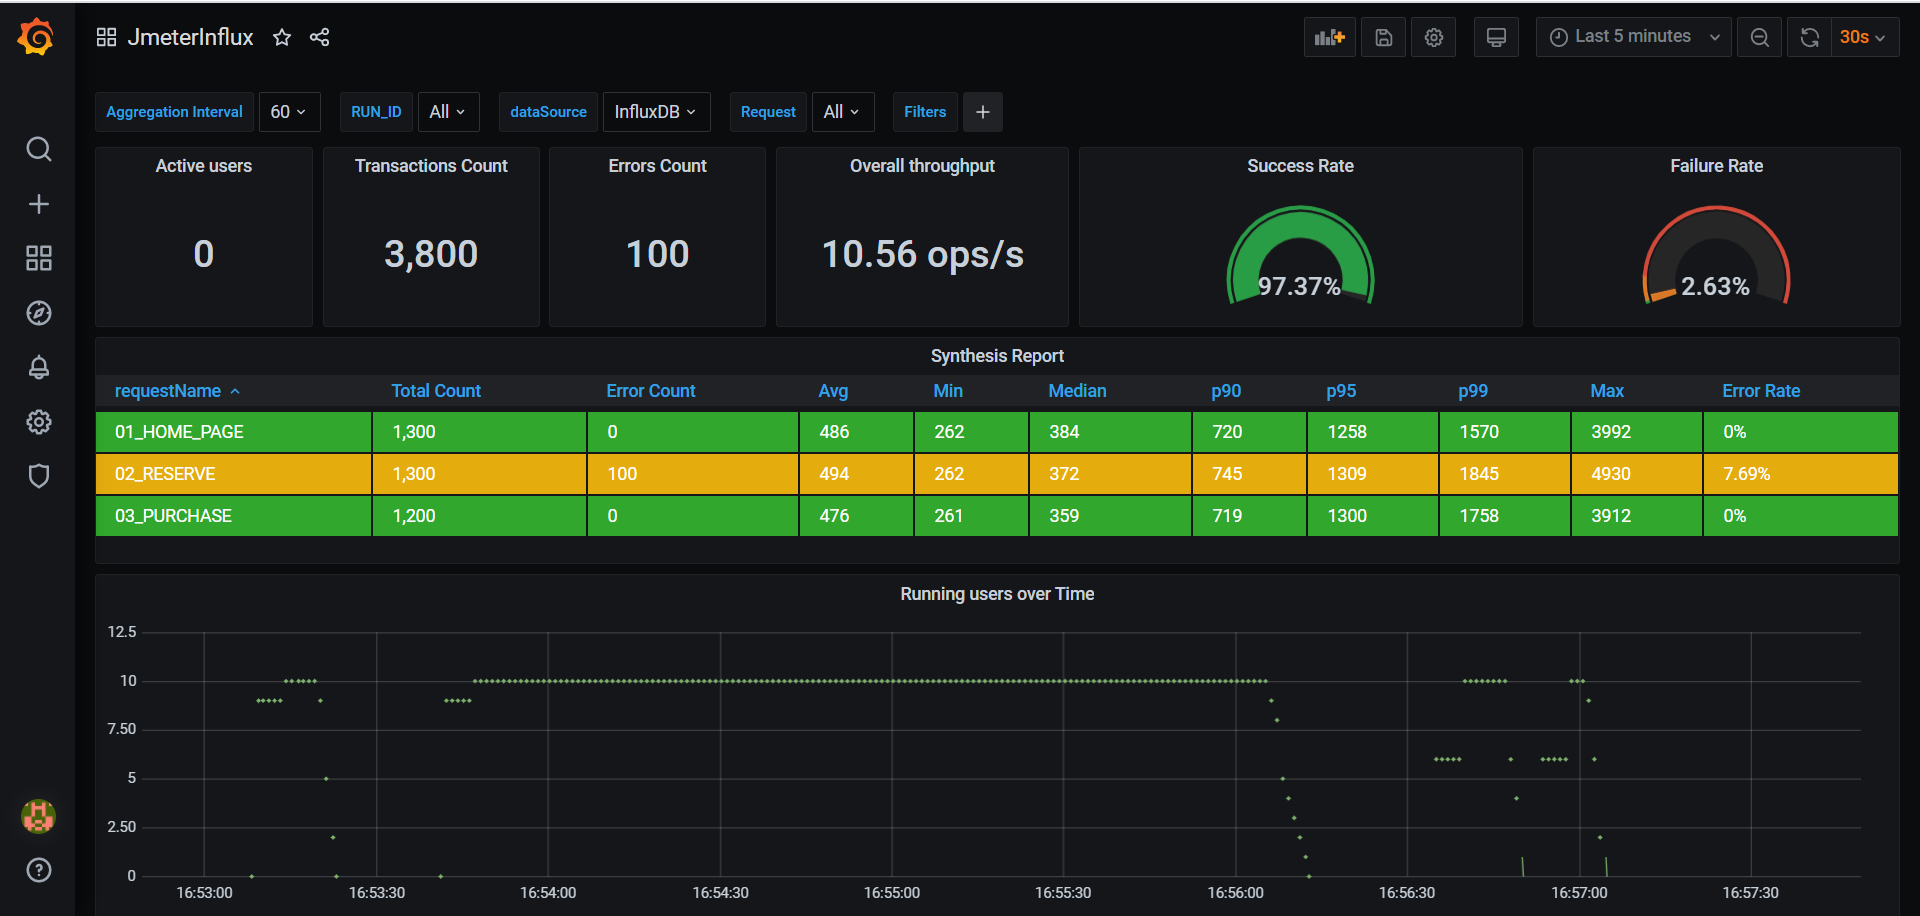
Monitor your Apache JMeter load test in real time with InfluxDB and Grafana. Get overall summary, errors details and particular transaction response times.
This dashboard was created for the InfluxdbBackendListernerClient, so it will work with JMeter 5.3 and up.
Steps:
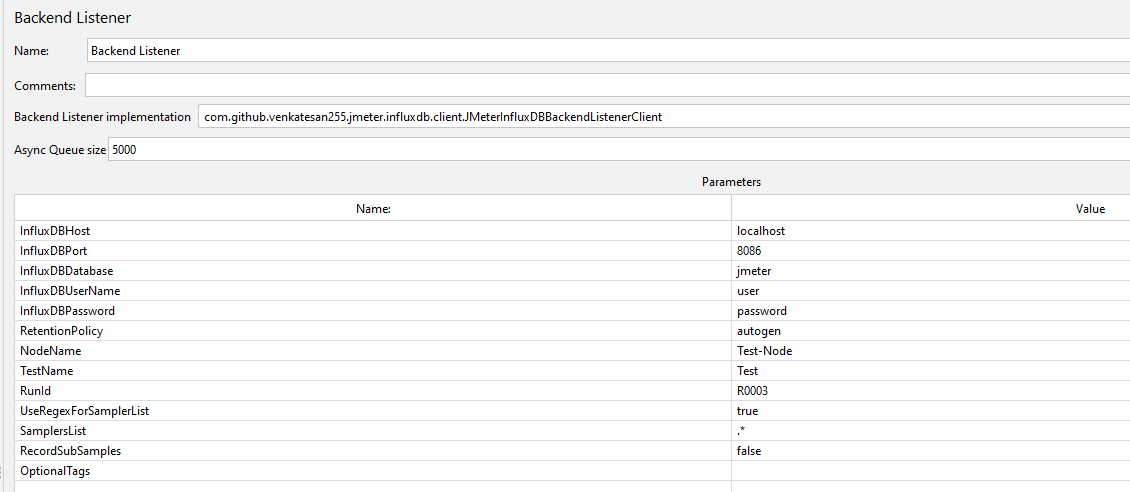
Create your Test Plan and add the InfluxdbBackendListernerClient to the test plan.
Configure the backend listener to write to your database
Create your database in InfluxDB
Import this dashboard into Grafana
Run the test.
Data source config
Collector type:
Collector plugins:
Collector config:
Dashboard revisions
Upload an updated version of an exported dashboard.json file from Grafana
| Revision | Decscription | Created | |
|---|---|---|---|
| Download |
Sign up for Grafana Cloud

Get up and running in minutes with the Grafana Cloud free tier, which includes free forever 10k metrics, 50GB logs, 50GB traces, 500 VUh, and more.
Get this dashboard
Data source:
Dependencies: