Loki stack monitoring (Promtail, Loki)
This dashboard can be used to detect issues on the Loki stack, when deployed in Kubernetes. Shows: some error metrics published by Promtail/Loki. Error and warning logs emitted by Promtail/Loki. Memory and CPU usage of Promtail/Loki compared against the Kubernetes memory/cpu limits and requests.
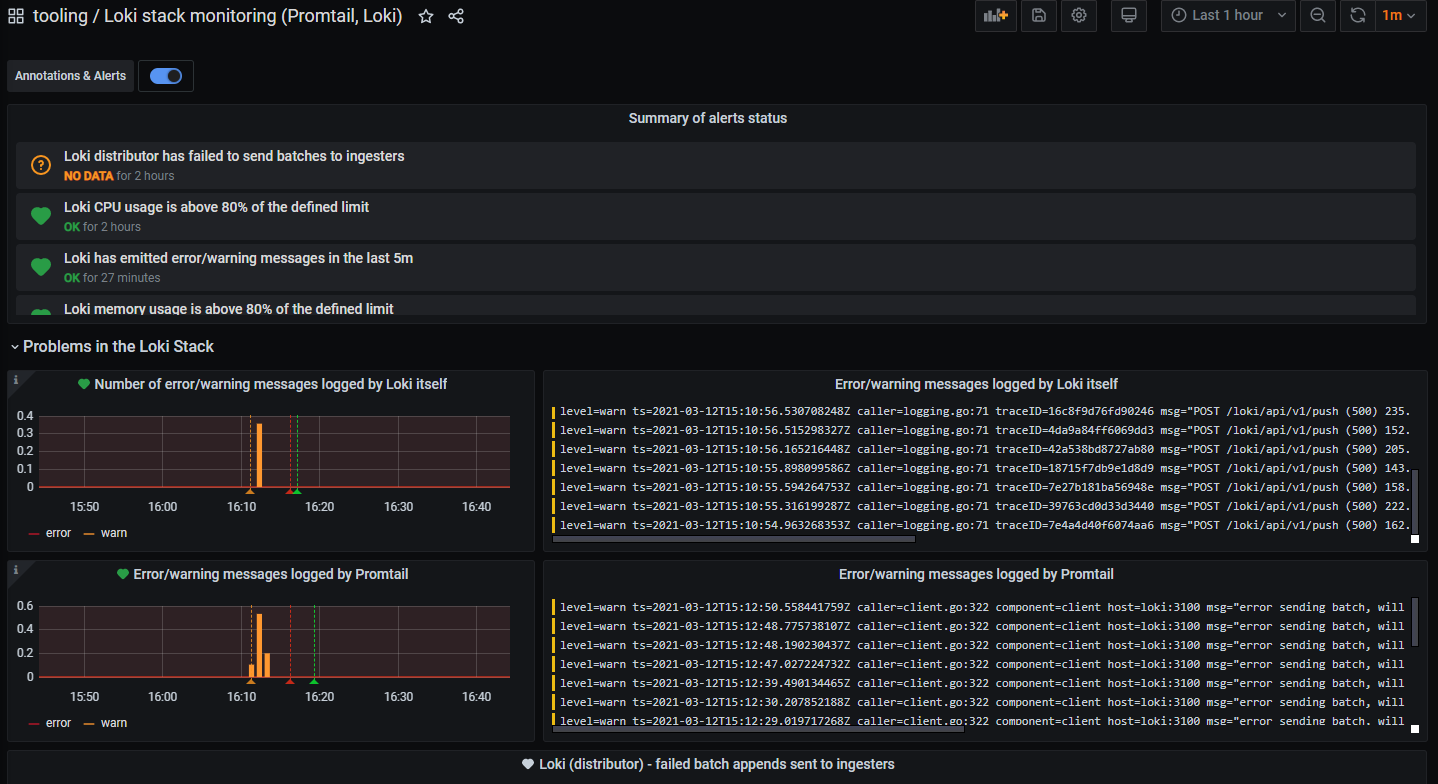
This dashboard can be used to detect issues on the Loki stack, when deployed in Kubernetes.
Shows:
- some error metrics published by Promtail/Loki
- error and warning logs emitted by Promtail/Loki
- memory and CPU usage of Promtail/Loki compared against the Kubernetes memory/cpu limits and requests.
Data source config
Collector type:
Collector plugins:
Collector config:
Revisions
Upload an updated version of an exported dashboard.json file from Grafana
| Revision | Description | Created | |
|---|---|---|---|
| Download |
Grafana Loki (self-hosted)
Easily monitor Grafana Loki (self-hosted), a horizontally scalable, highly available, multi-tenant log aggregation system inspired by Prometheus, with Grafana Cloud's out-of-the-box monitoring solution.
Learn more