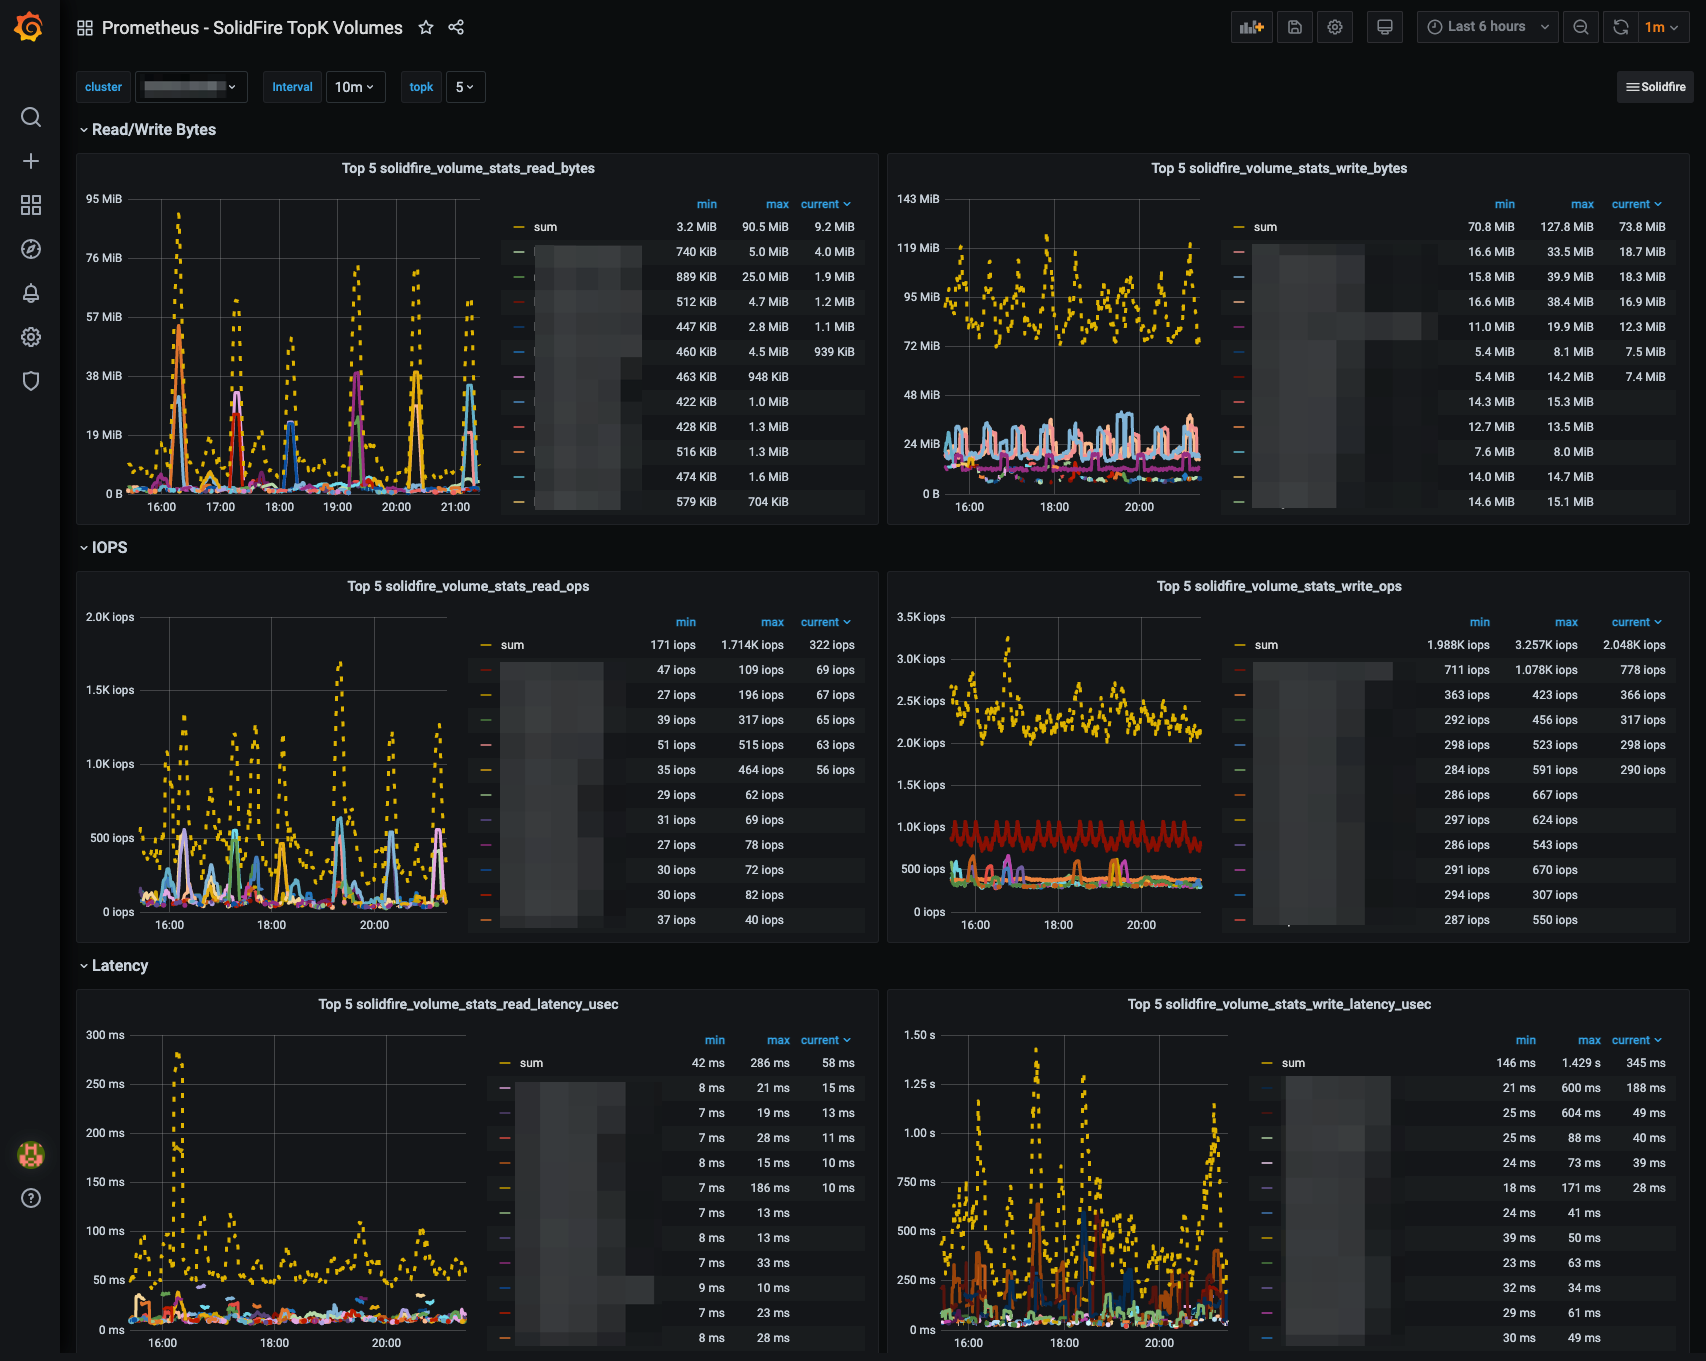
SolidFire TopK Volumes (DEPRECATED)
NetApp SolidFire TopK Volumes powered by https://github.com/mjavier2k/solidfire-exporter
DEPRECATED - NetApp SolidFire TopK Volumes Overview
This dashboard is no longer maintained and will only work with versions v0.5.2 or earlier of solidfire-exporter
The SolidFire TopK dashboard contains the following statistics for the top K busiest volumes:
- Read Bytes
- Write Bytes
- Read Ops
- Write Ops
- Read Latency
- Write Latency
It can serve as a high-level troubleshooting point to find the busiest volumes on the SolidFire cluster.
See also:
- SolidFire Cluster Overview
- SolidFire Volume Details
- SolidFire Node Details
- SolidFire TopK Volumes
- SolidFire Overutilized Volume
The sfcluster label is required for the dashboard to work properly - be sure to add it in your Prometheus scrape config:
- job_name: solidfire_exporter
  honor_timestamps: true
  scrape_interval: 30s
  scrape_timeout: 20s
  metrics_path: /metrics
  scheme: http
  static_configs:
  - targets:
    - localhost:9987
    labels:
      sfcluster: sfcluster01

Data source config
Collector config:
Upload an updated version of an exported dashboard.json file from Grafana
| Revision | Description | Created | |
|---|---|---|---|
| Download |
