Solidfire Node Detail

NetApp SolidFire Node Detail
Since revision 2, this dashboard requires version v0.6.0 or higher of solidfire-exporter
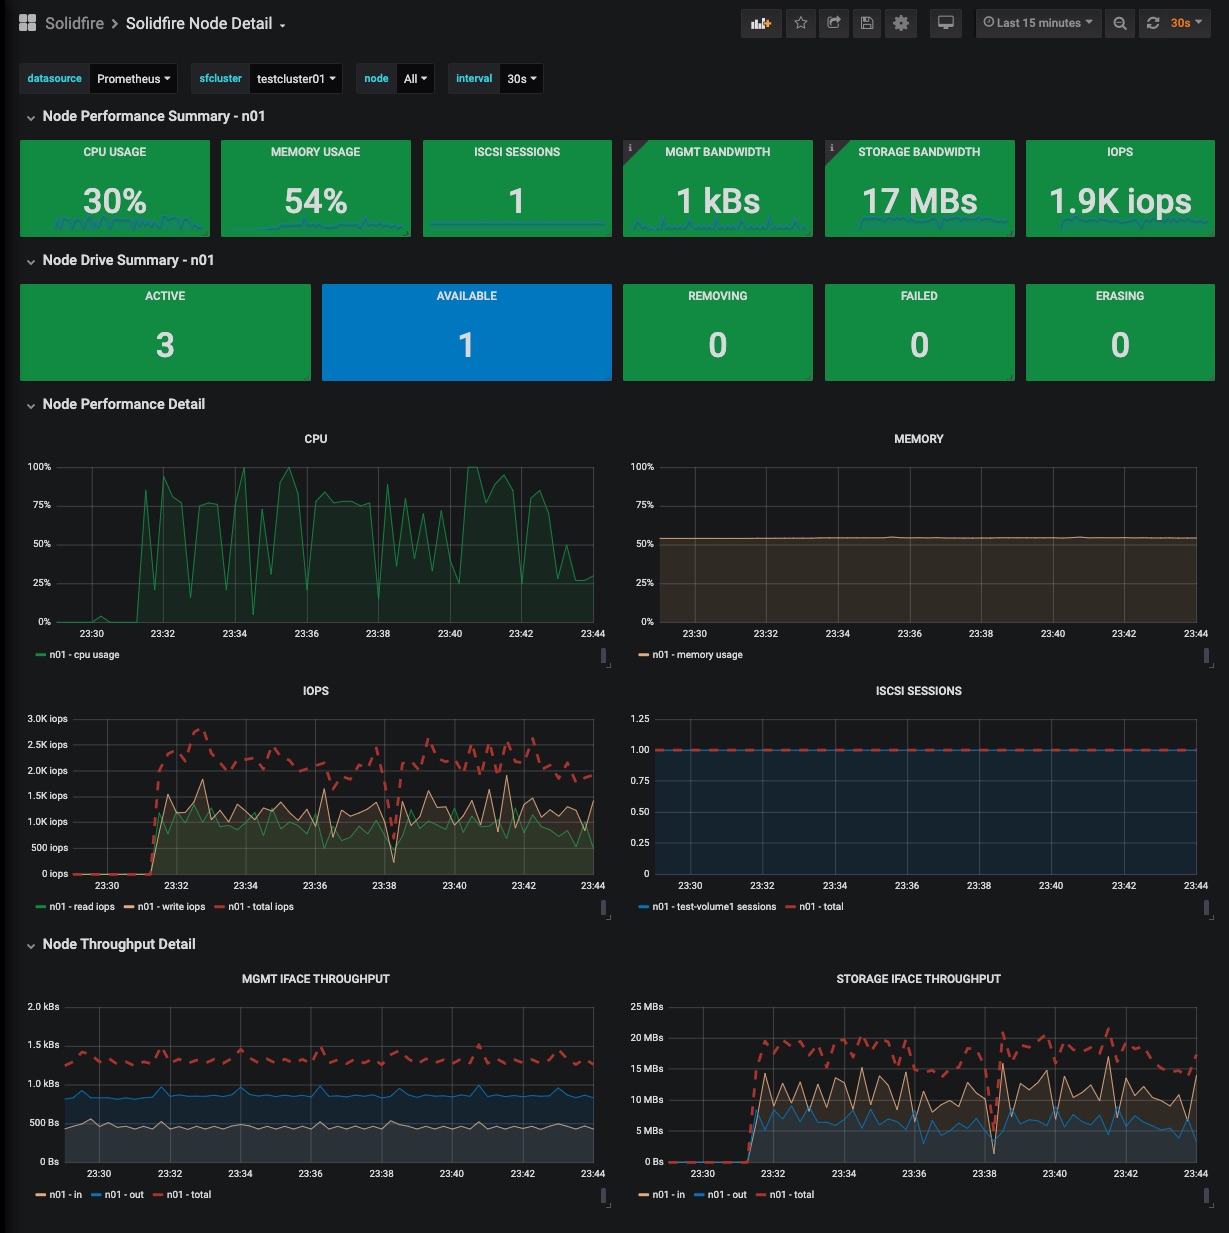
The node details dashboard contains information about:
- Node Read/Write IOPS
- Node CPU
- Node CPU/Memory
- Drive status
- iSCSI session counts
- Throughput
See also:
The sfcluster label is required for the dashboard to work properly - be sure to add it in your Prometheus scrape config:
- job_name: solidfire_exporter
  honor_timestamps: true
  scrape_interval: 30s
  scrape_timeout: 20s
  metrics_path: /metrics
  scheme: http
  static_configs:
  - targets:
    - localhost:9987
    labels:
      sfcluster: sfcluster01
Data source config
Collector type:
Collector plugins:
Collector config:
Revisions
Upload an updated version of an exported dashboard.json file from Grafana
| Revision | Description | Created | |
|---|---|---|---|
| Download |
Linux Server
Monitor Linux with Grafana. Easily monitor your Linux deployment with Grafana Cloud's out-of-the-box monitoring solution.
Learn more