Fortigate Prometheus Exporter
A Dashboard for the Prometheus fortigate_exporter
Dashboard for the fortigate_exporter available @ https://github.com/bluecmd/fortigate_exporter
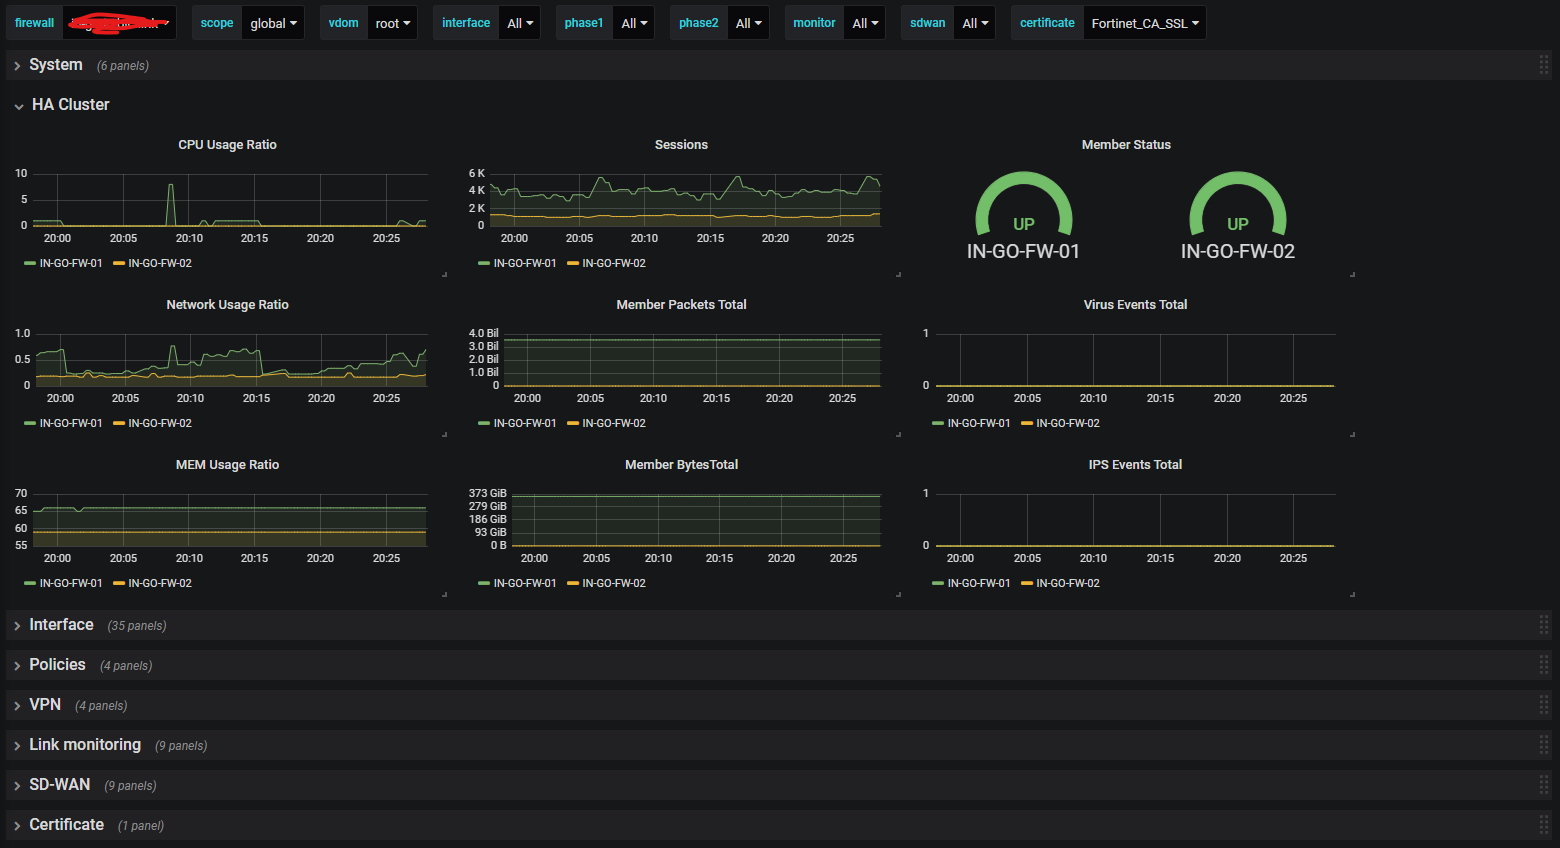
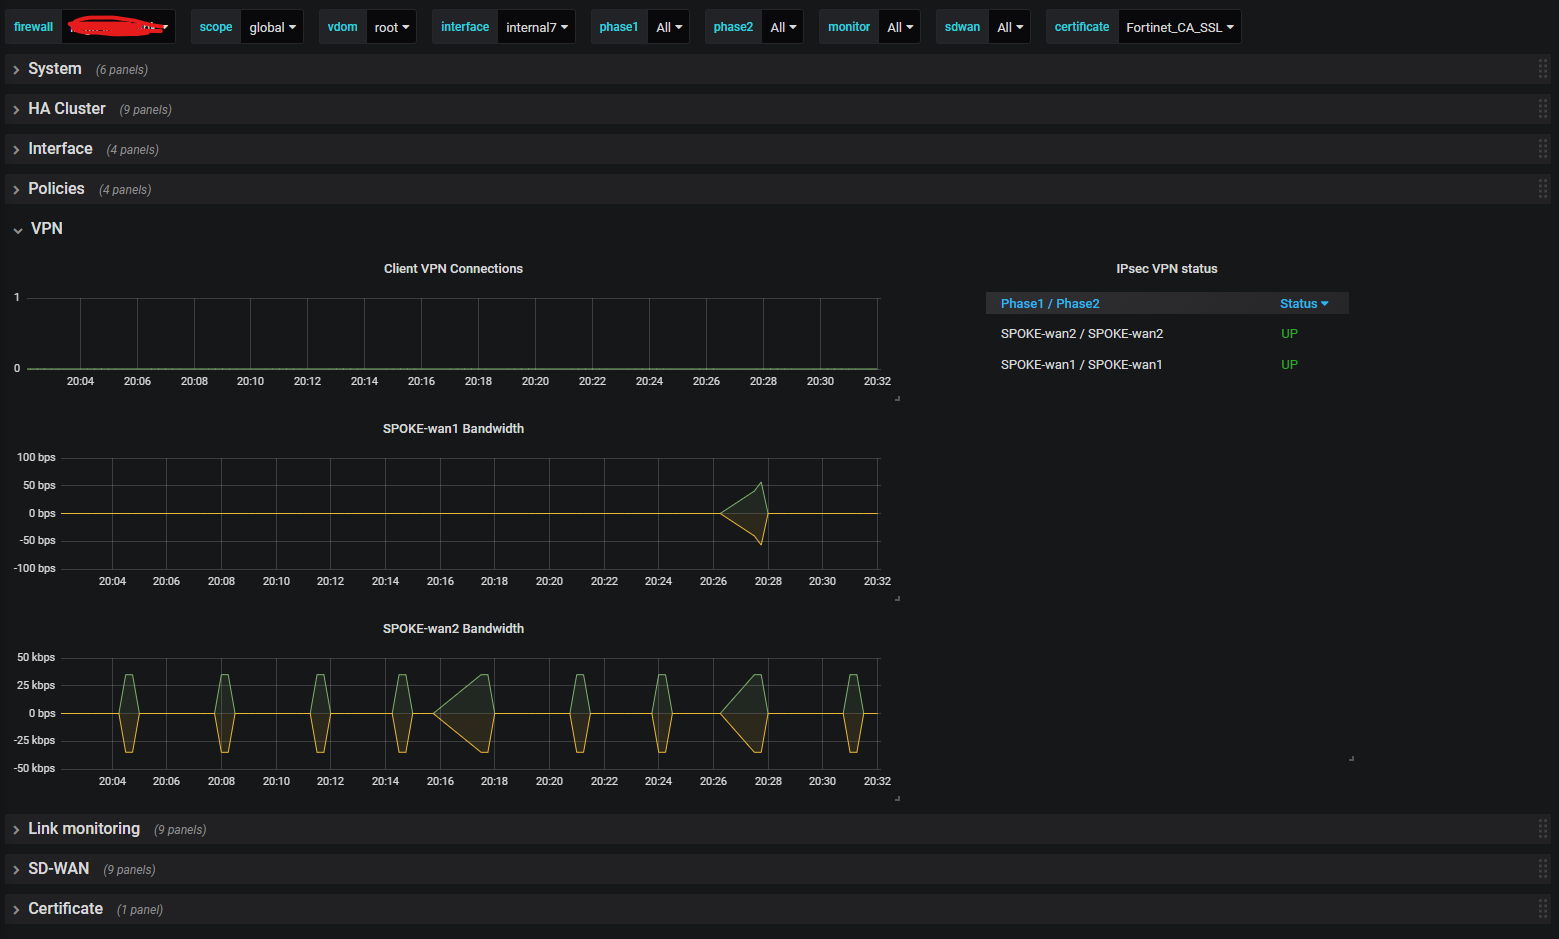
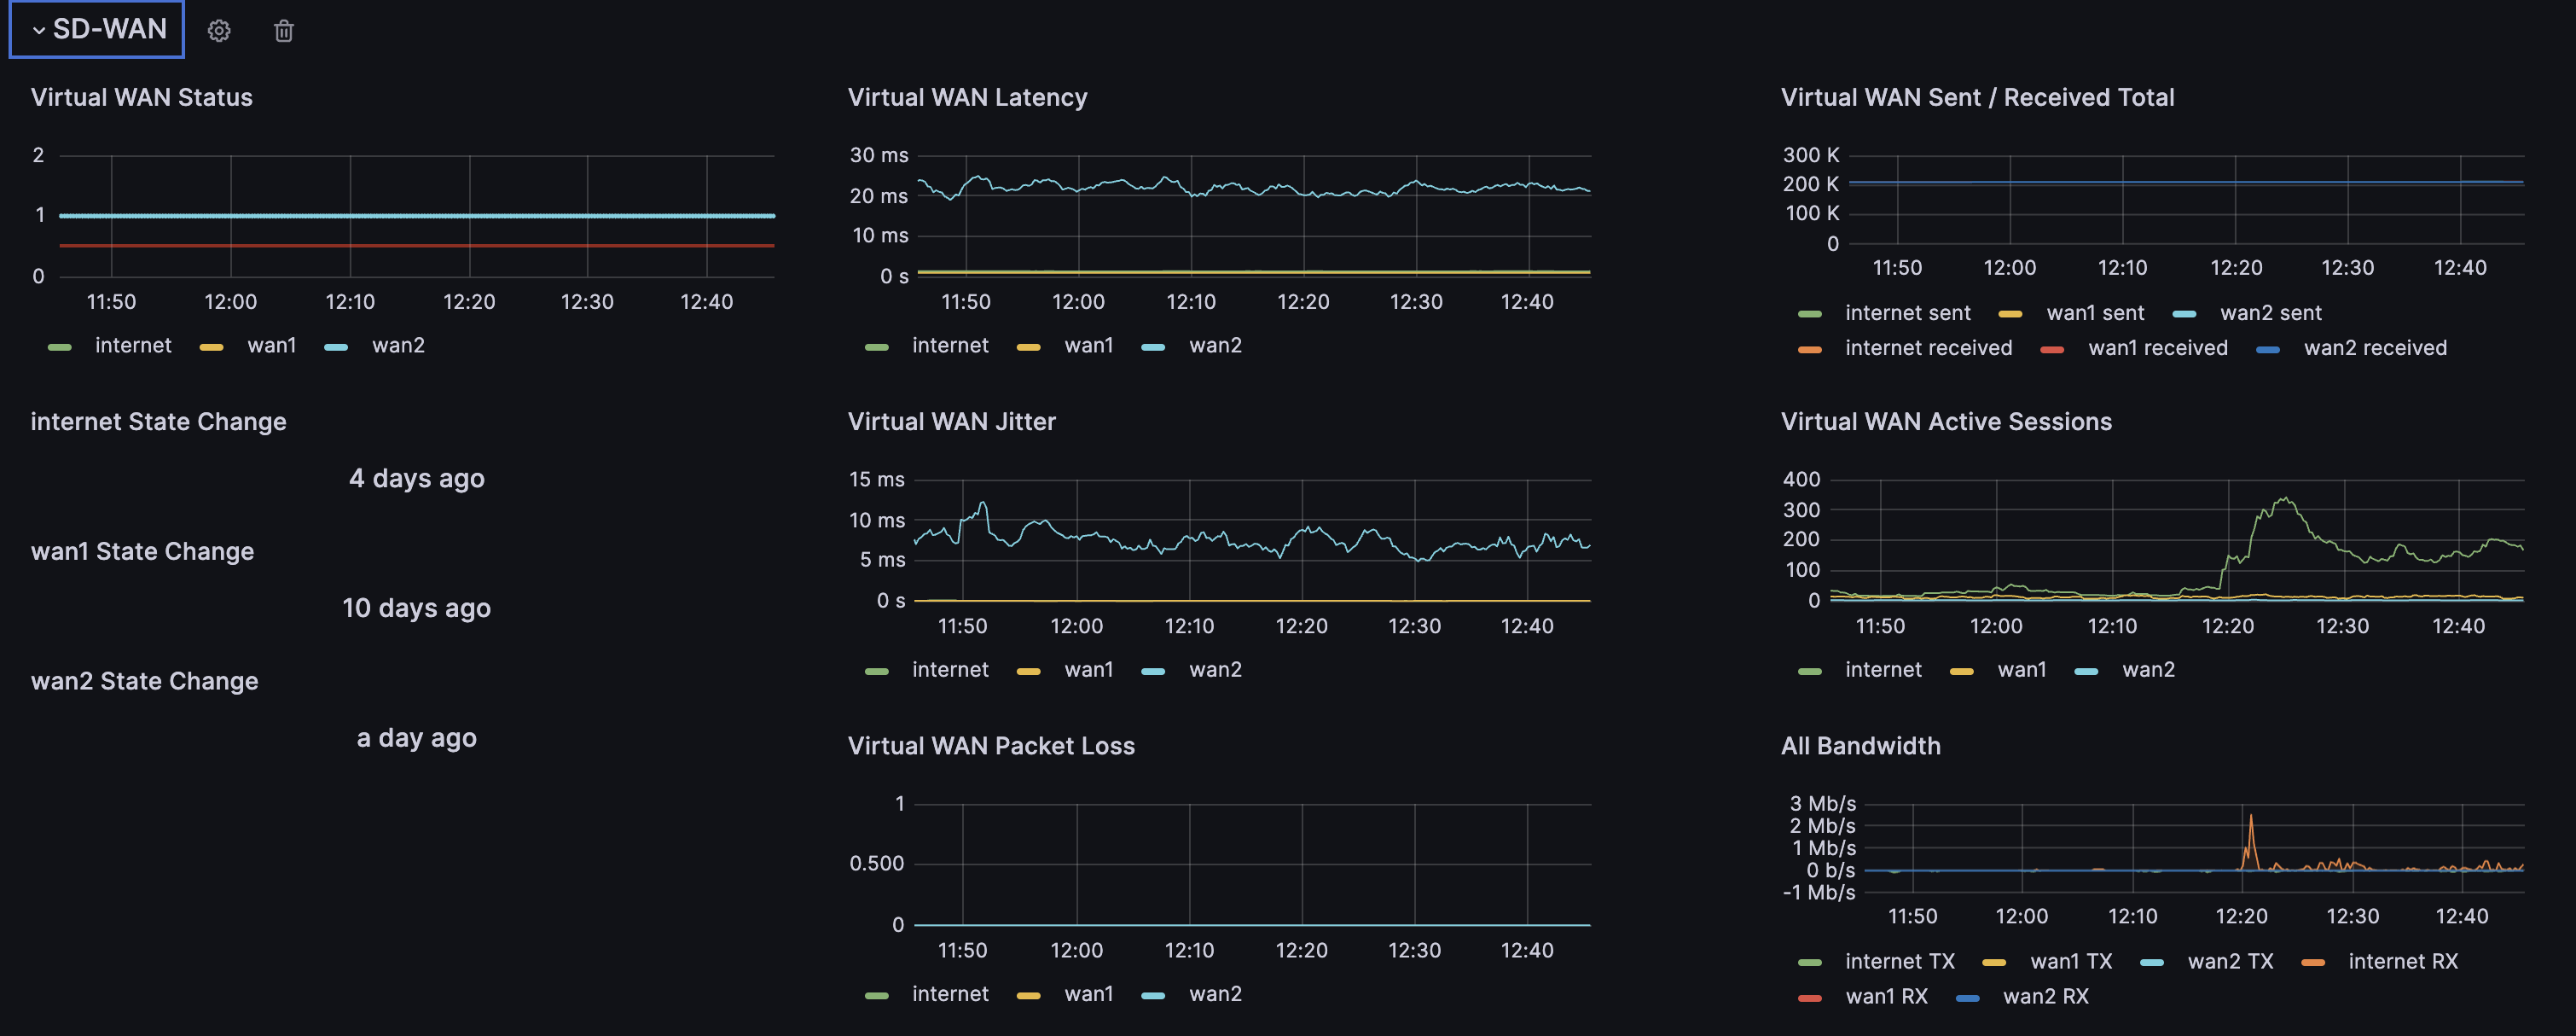
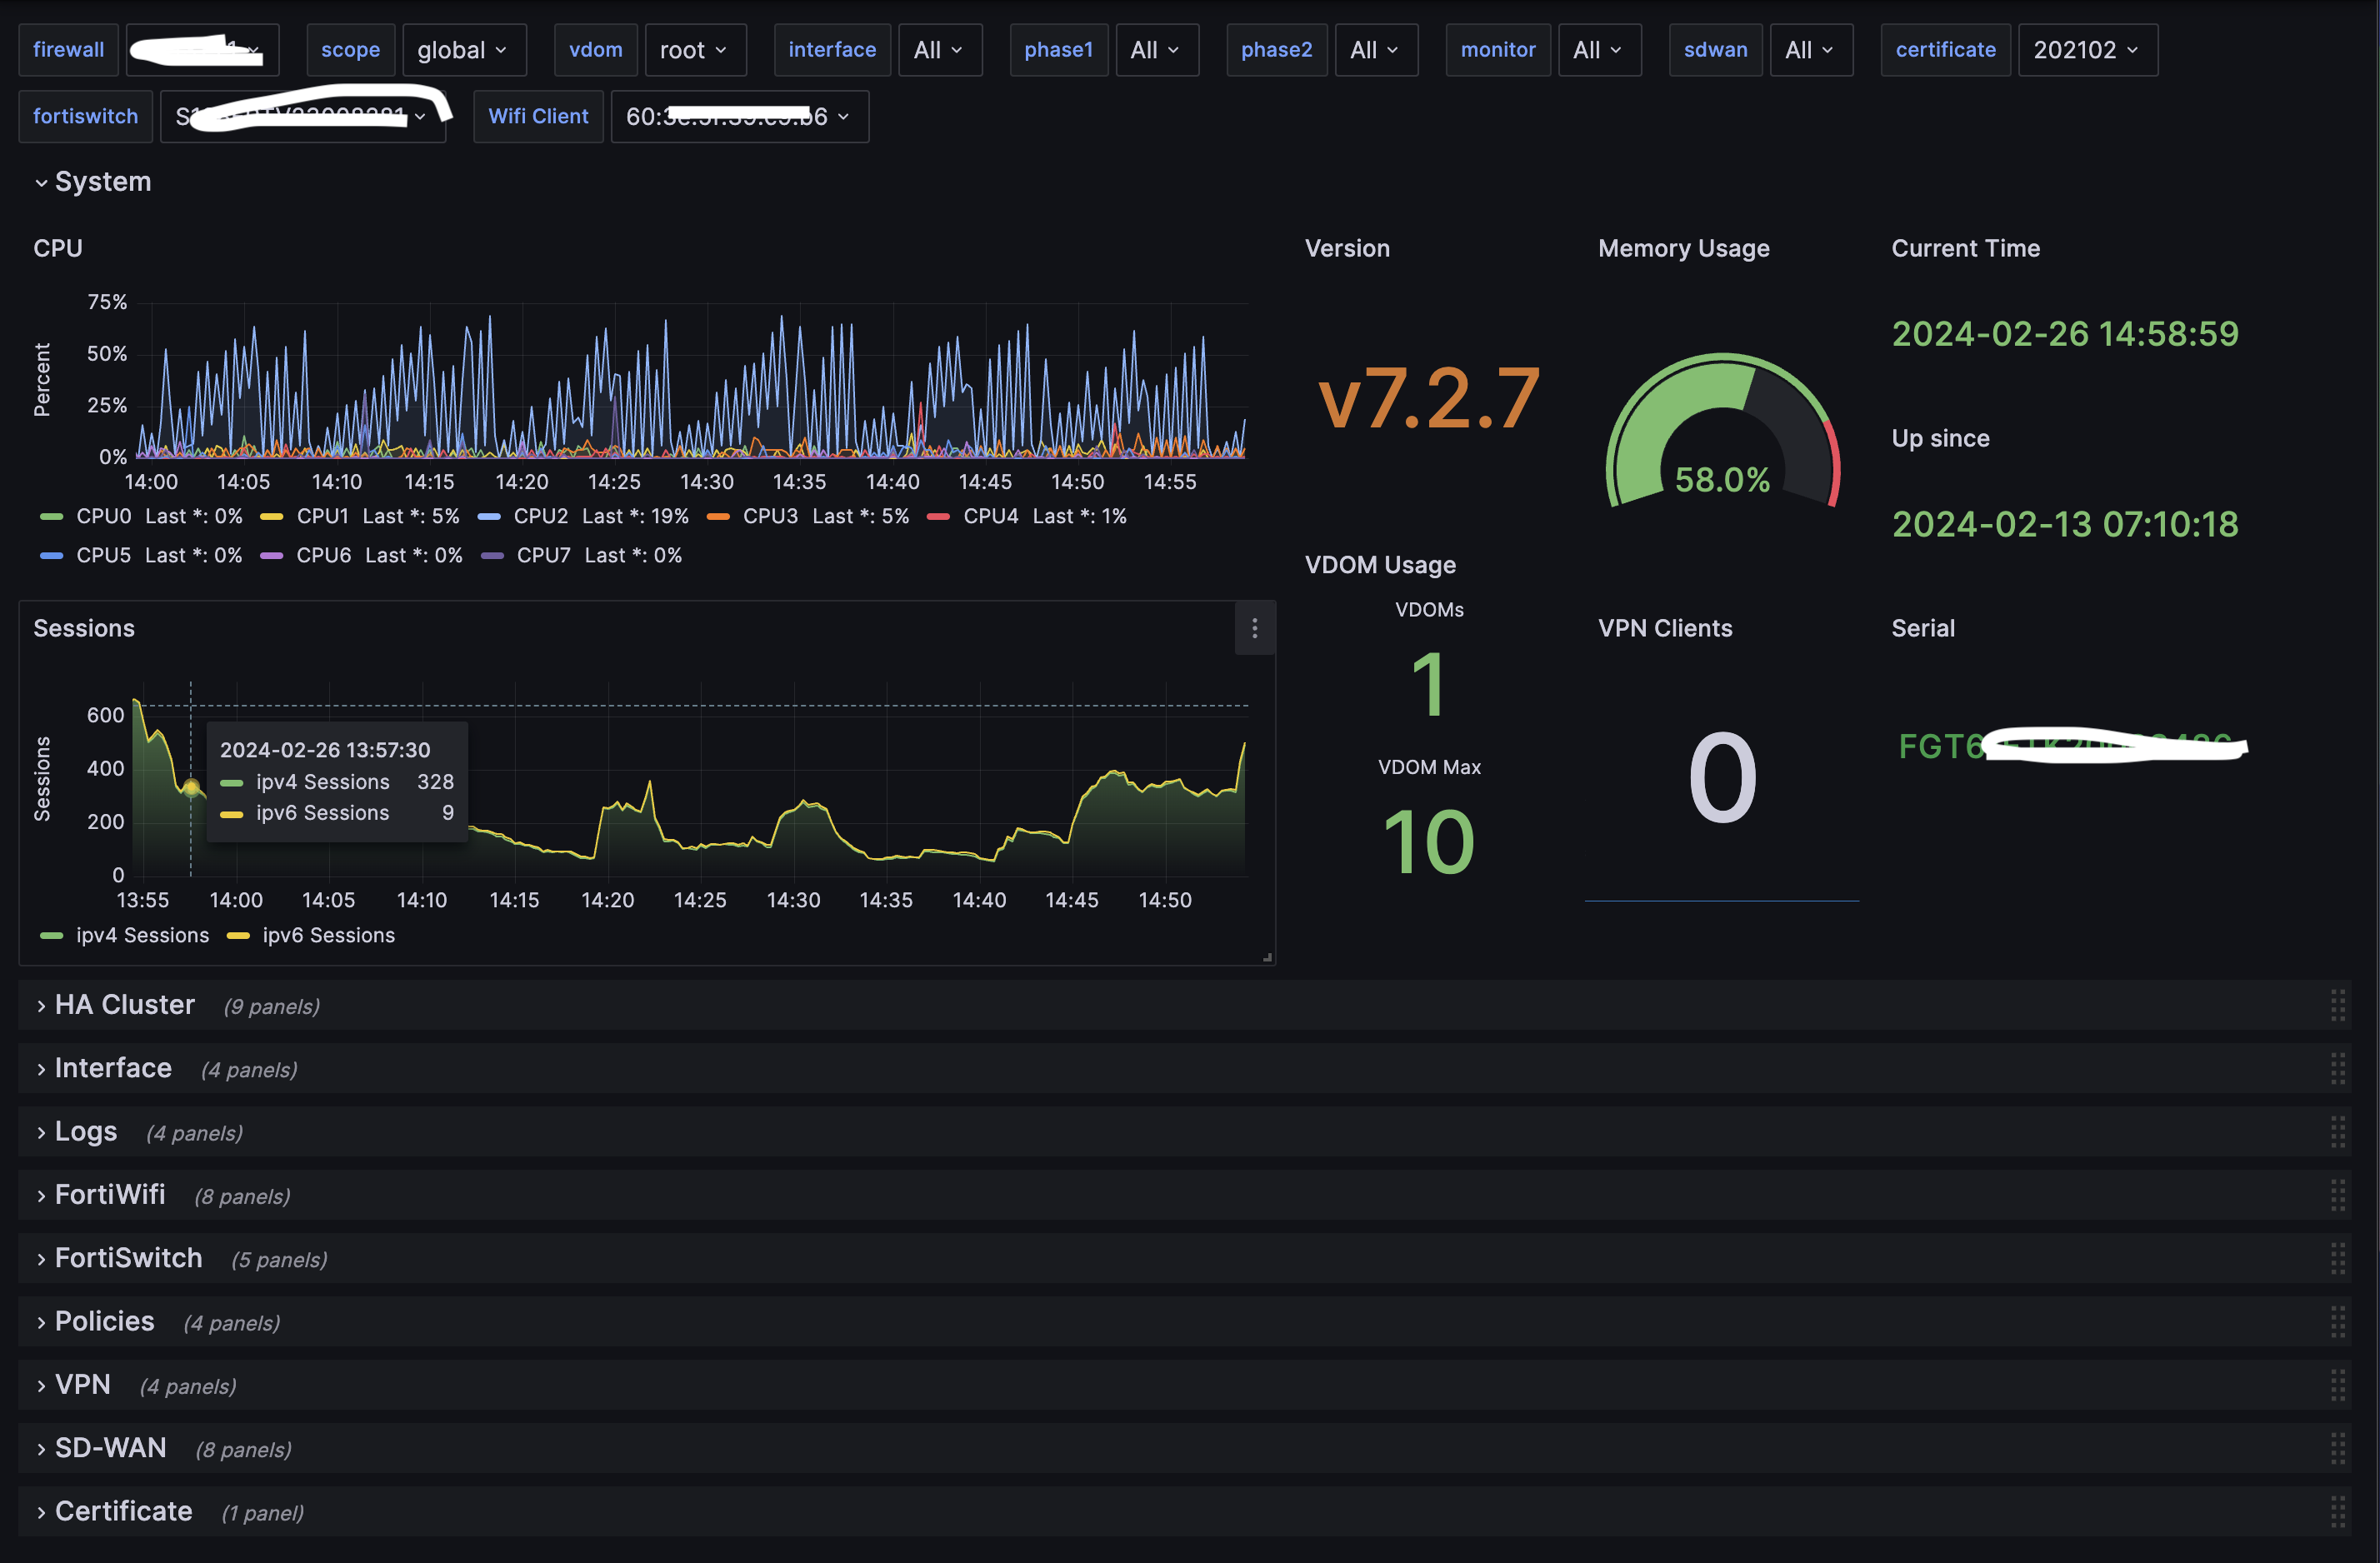
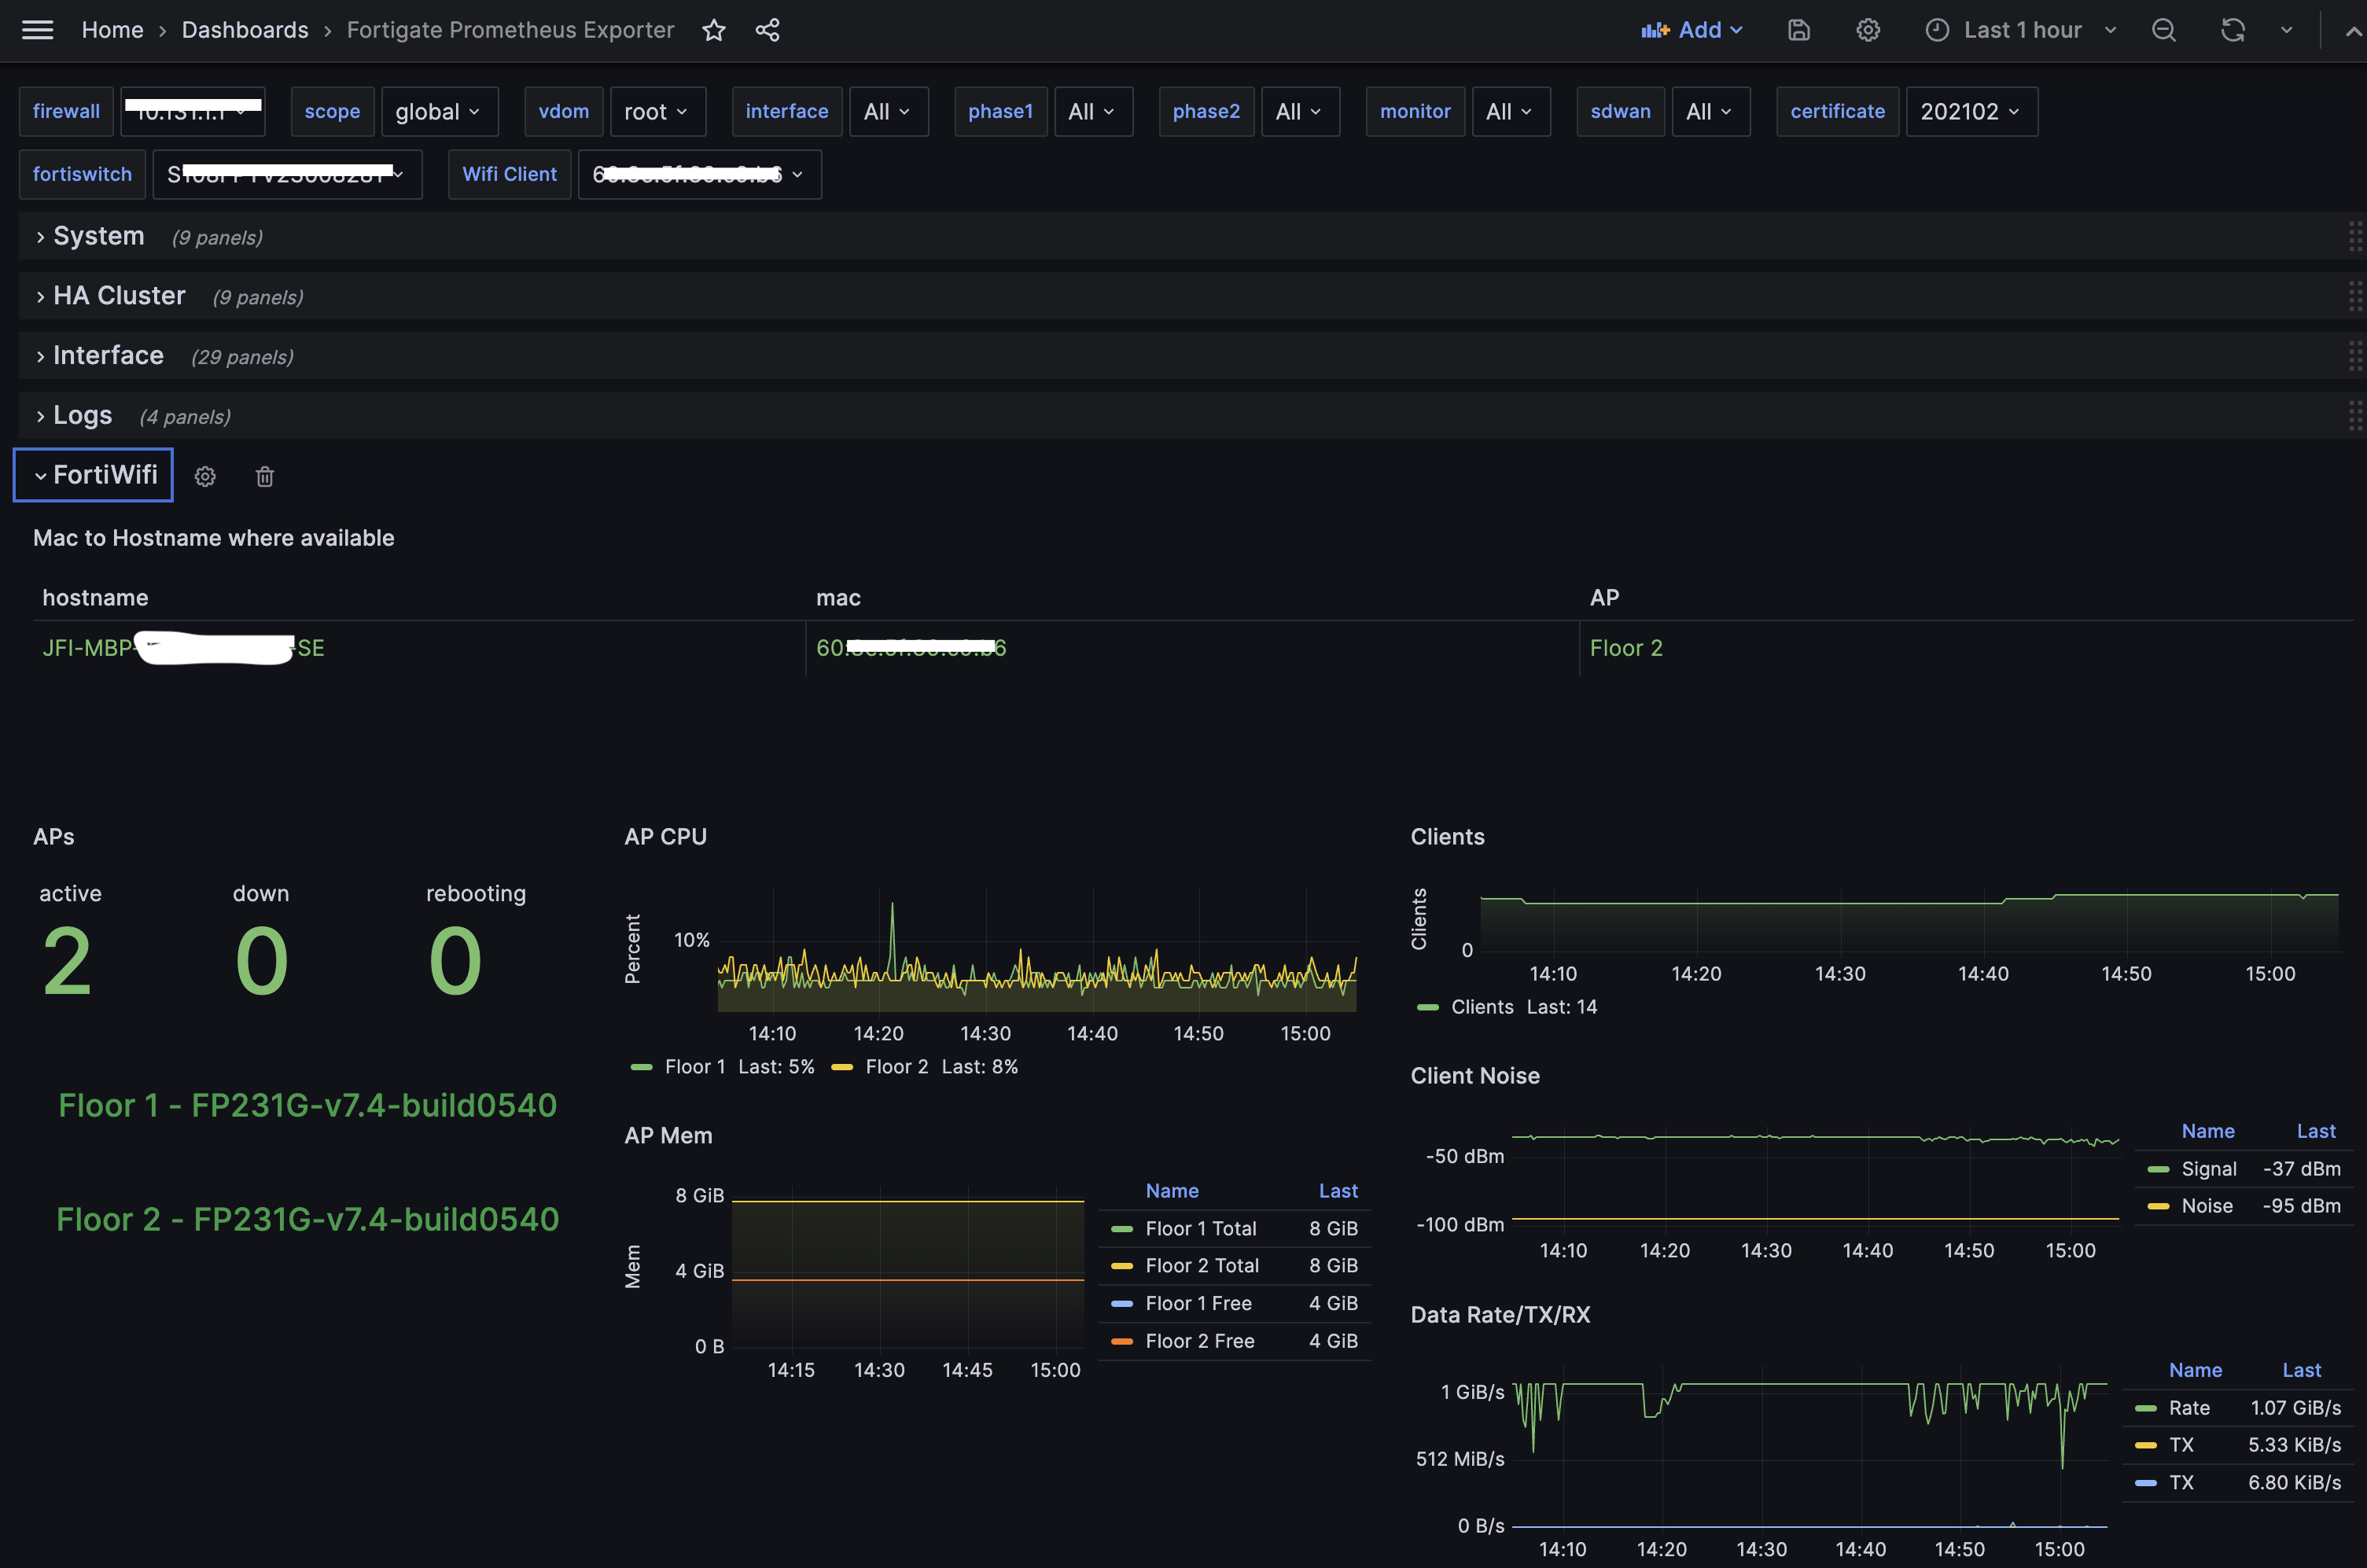
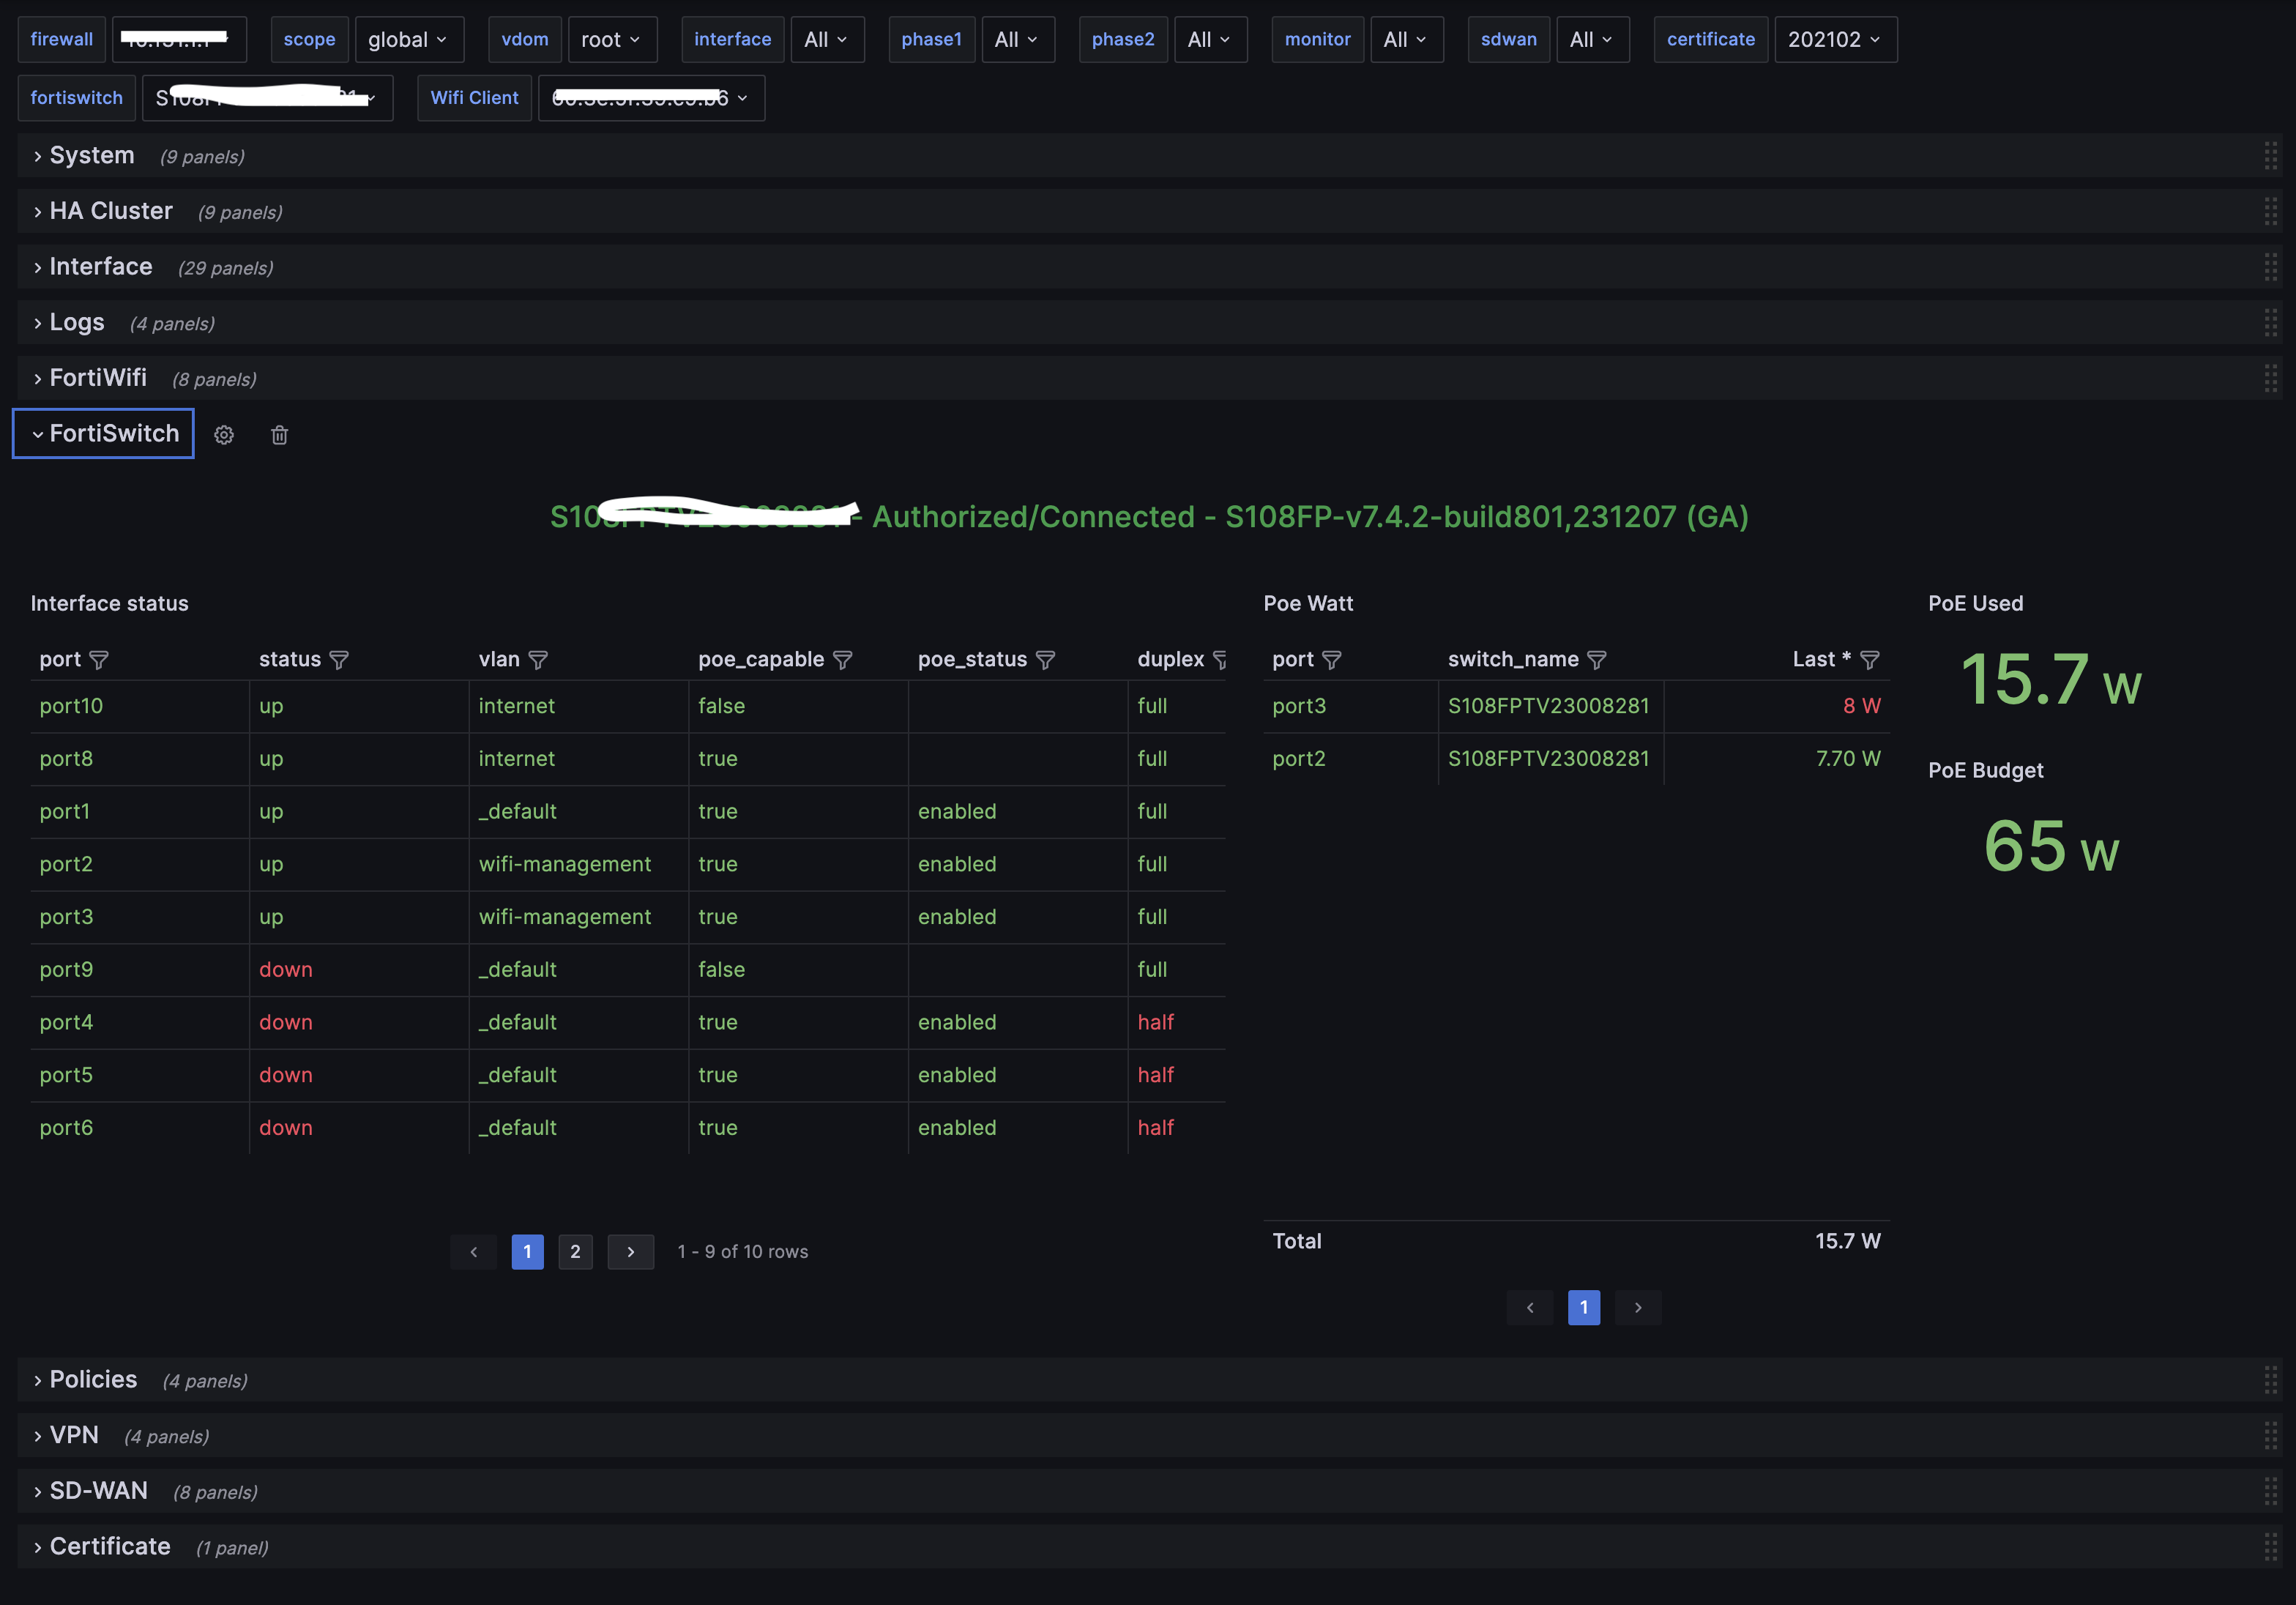
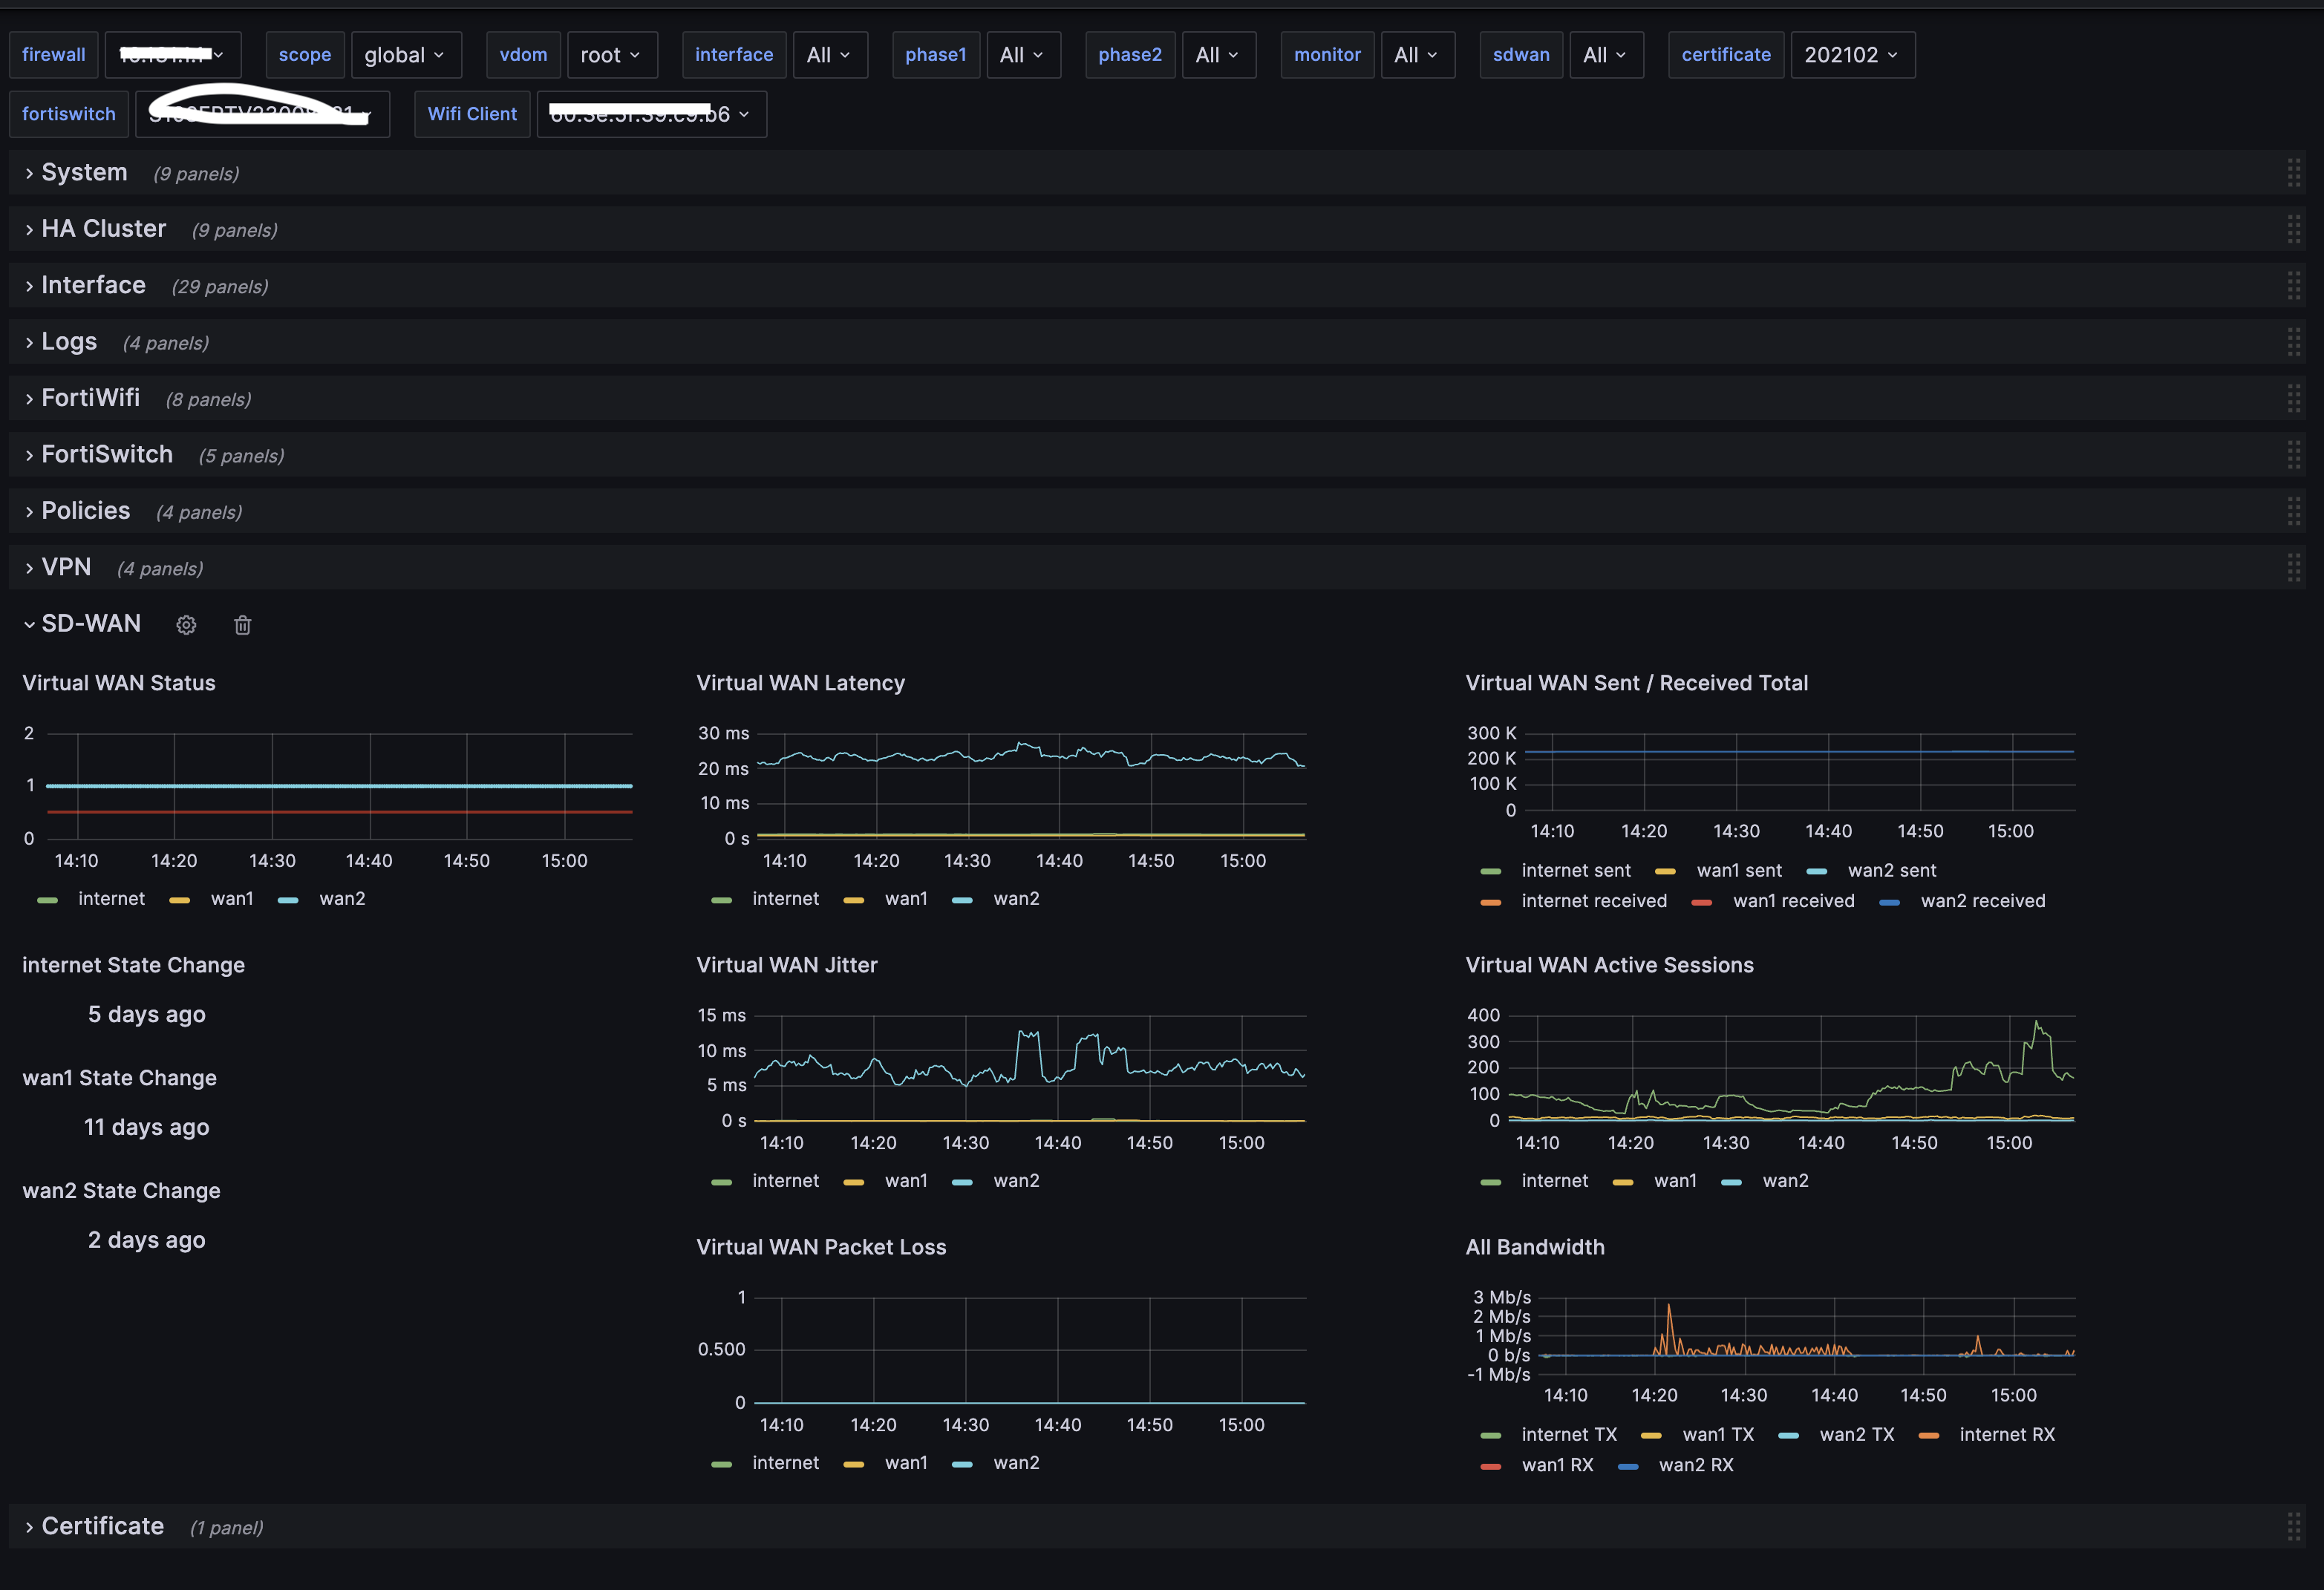
It visualizes most of the data available in the scrape, support for multiple Firewalls via variables and it is segmented to be easier to see the interesting parts.
Let me know about suggestions and improvements.
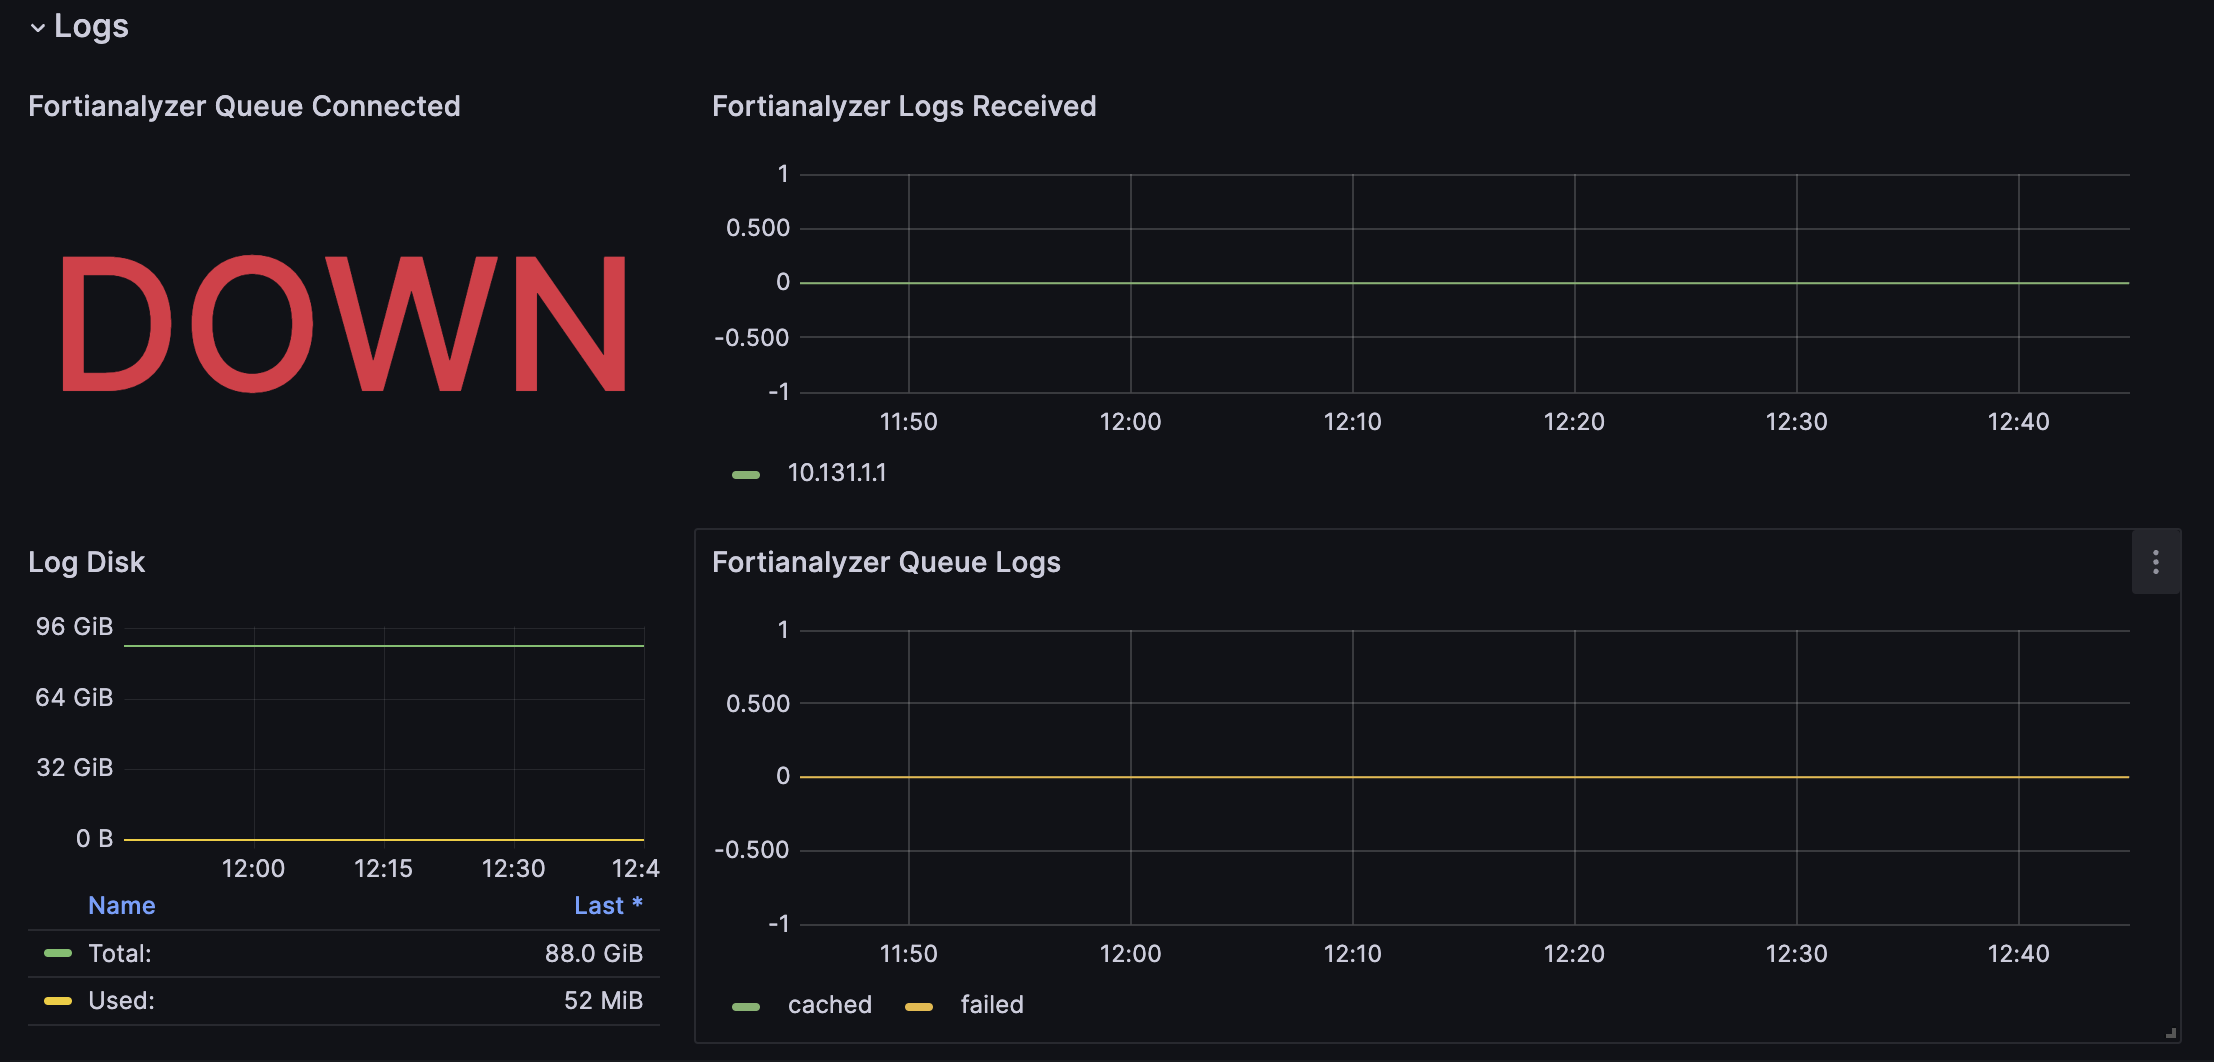
- Updated version with Analyzer, Wifi and Switch, please note that in order to get switch data after v. 7.2 you need to edit "managed_switch.go" to look like this: "api/v2/monitor/switch-controller/managed-switch/status"
Data source config
Collector type:
Collector plugins:
Collector config:
Revisions
Upload an updated version of an exported dashboard.json file from Grafana
| Revision | Description | Created | |
|---|---|---|---|
| Download |
Metrics Endpoint (Prometheus)
Easily monitor any Prometheus-compatible and publicly accessible metrics URL with Grafana Cloud's out-of-the-box monitoring solution.
Learn more