OCI Compute Instance Monitoring
OCI Instance Metrics Monitoring Dashboard For Grafana 8.3.X Created by Ram N Sangwan
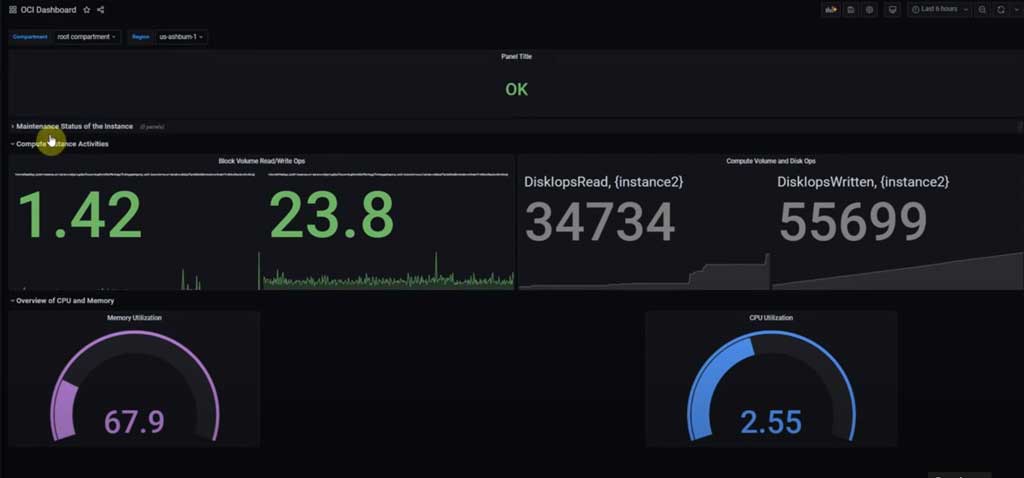
Learn to create a Grafana Dashboard from scratch. The demo uses a data source plugin for Oracle Cloud Infrastructure. The dashboard created use the metrics fetched by data source plugin and use it for Monitoring Instances, Block Volumes and Virtual Cloud Networks. The Dashboard created will be uploaded on Grafana website to be used by community.
To watch a demo on how this dashboard was created, visit https://www.youtube.com/watch?v=RUJqjTkNQgg
Data source config
Collector type:
Collector plugins:
Collector config:
Revisions
Upload an updated version of an exported dashboard.json file from Grafana
| Revision | Description | Created | |
|---|---|---|---|
| Download |