Cisco FTD System On Azure Application Insights
Basic Metrics from Cisco FTD devices uploaded to Azure Application Insights.
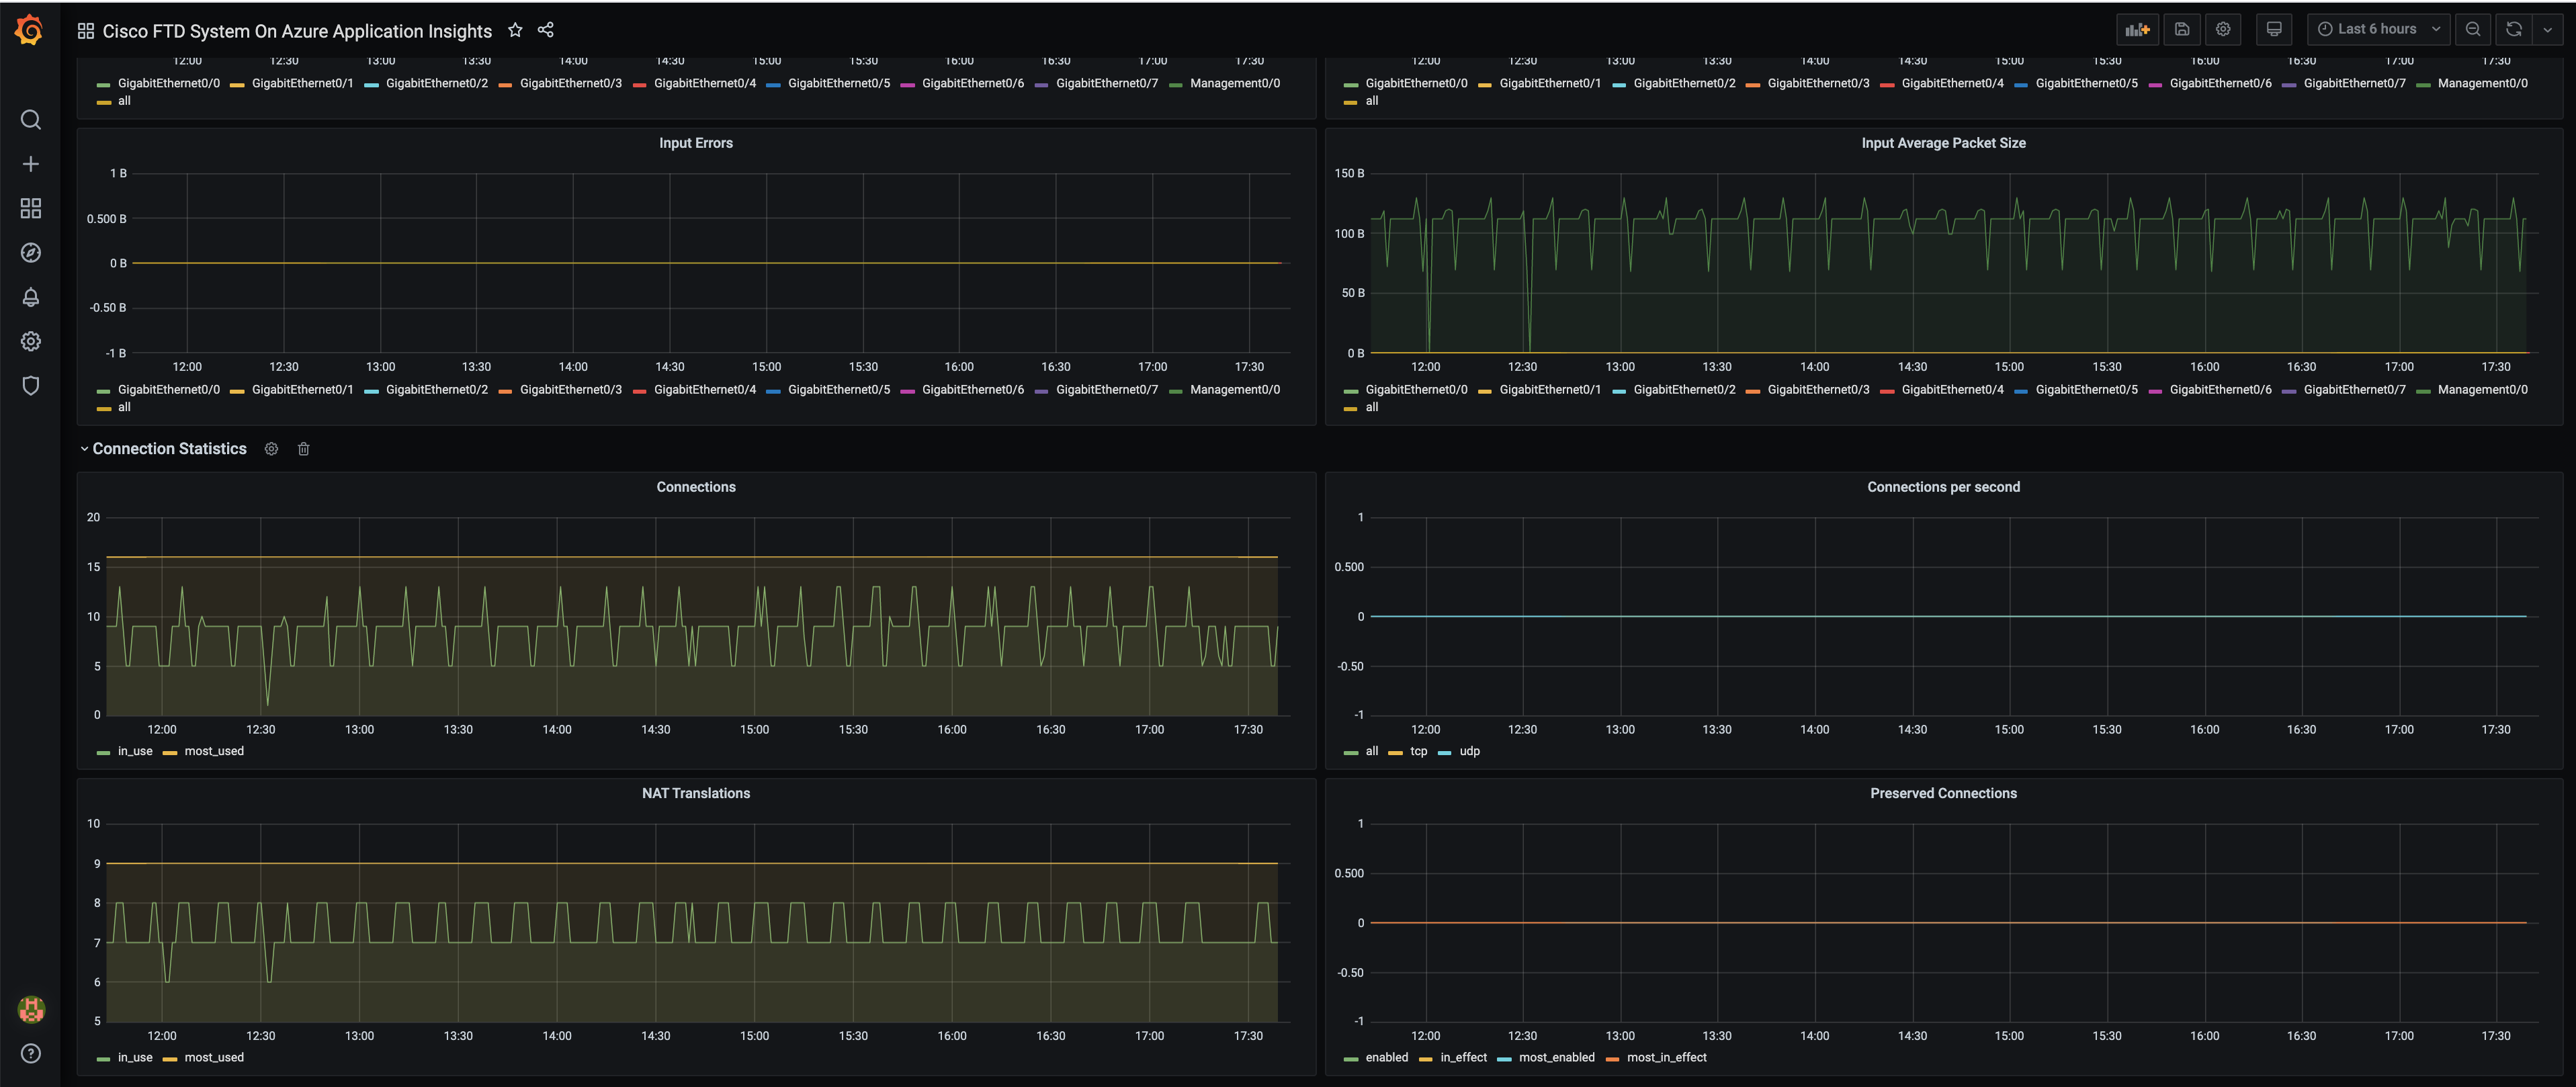
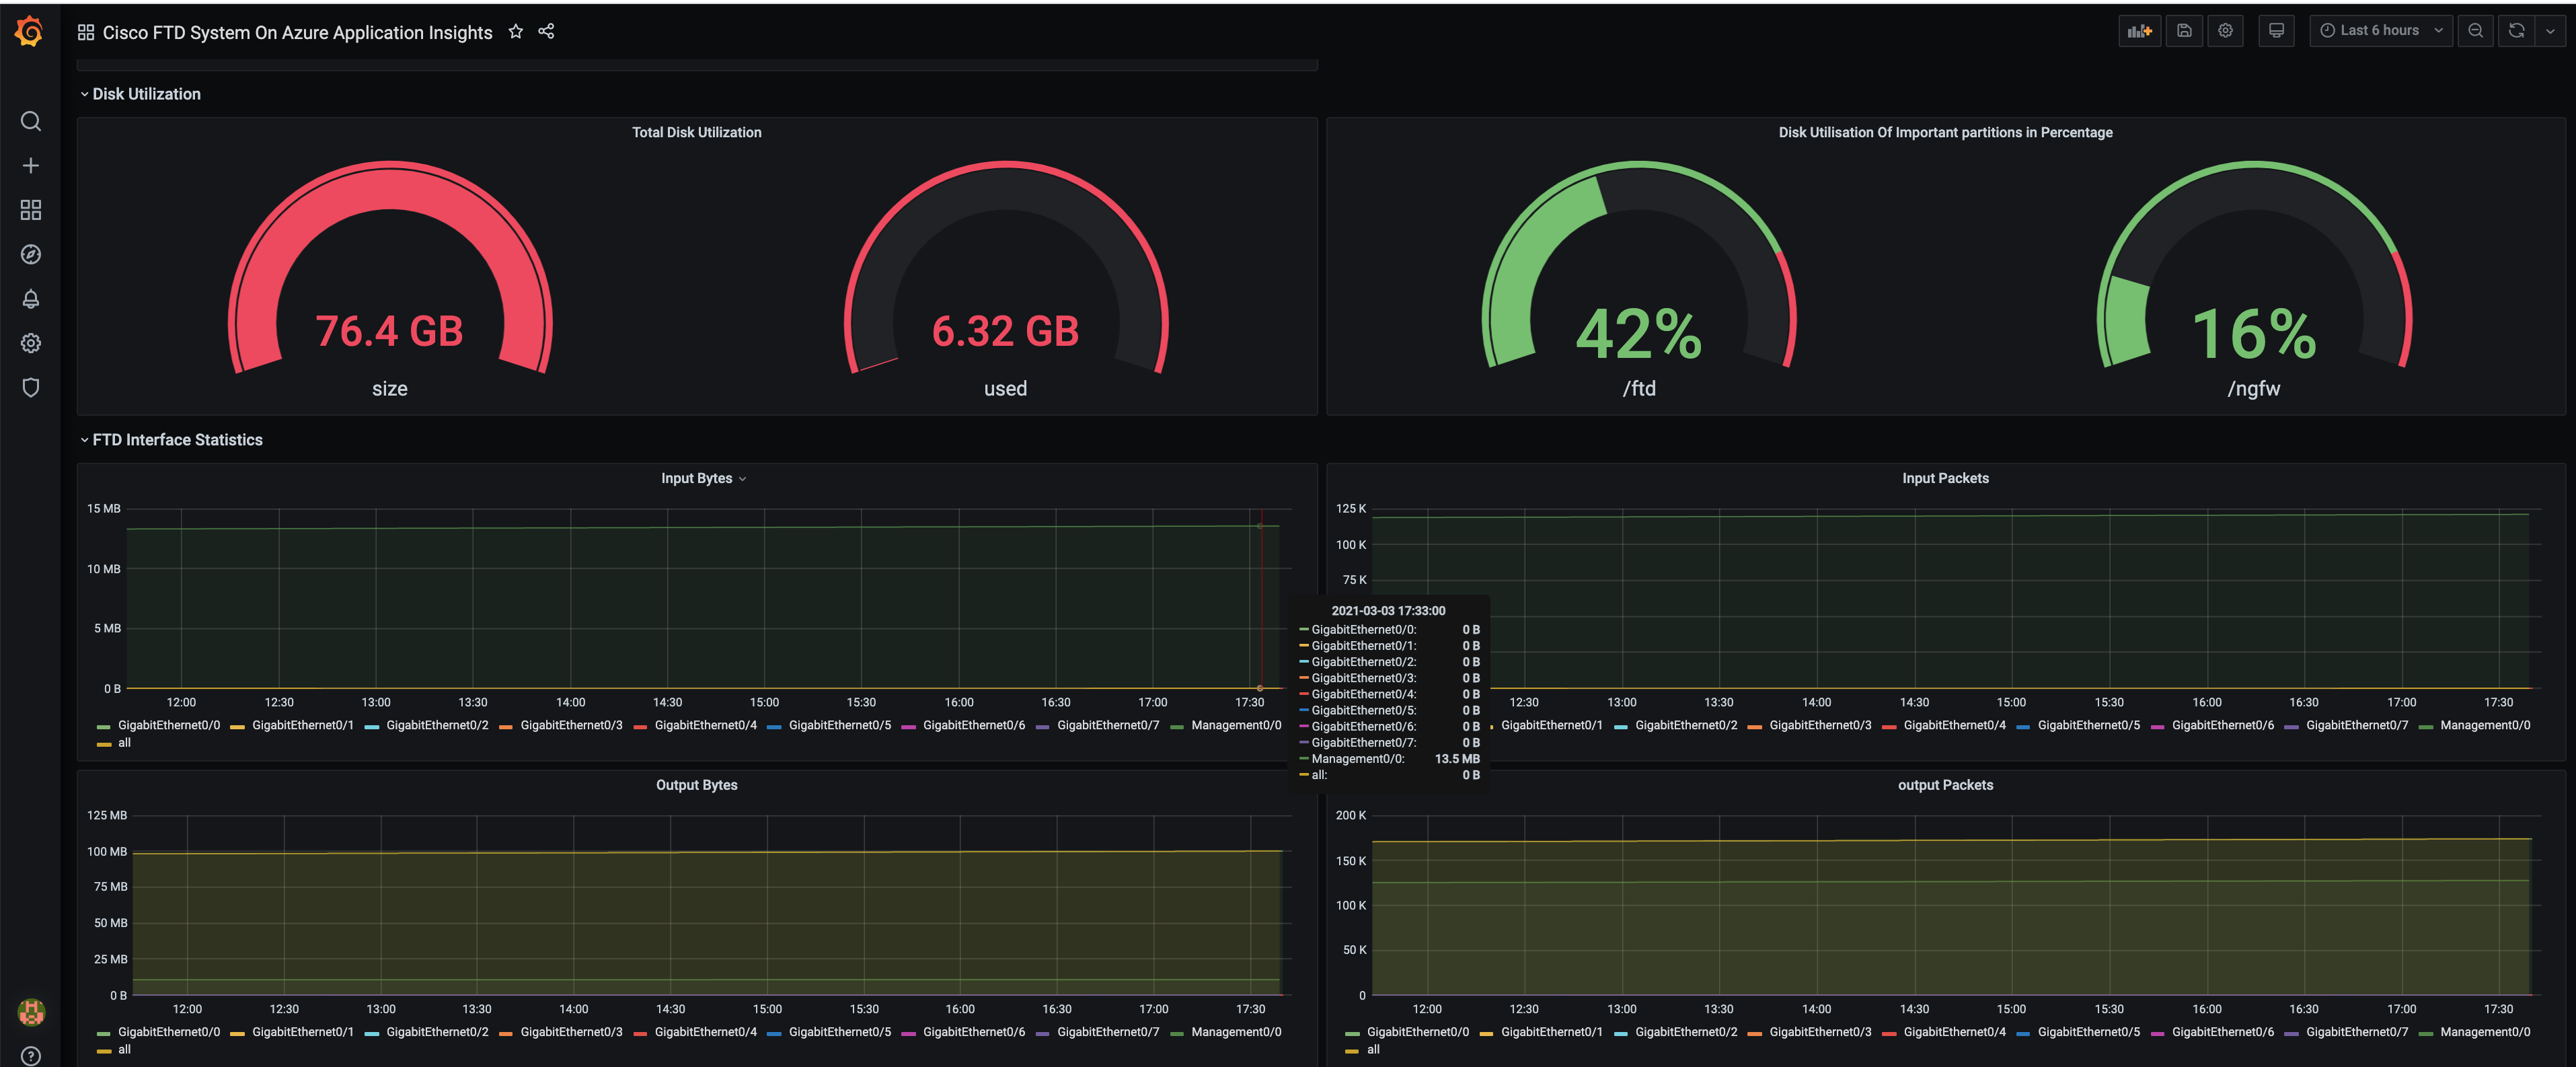
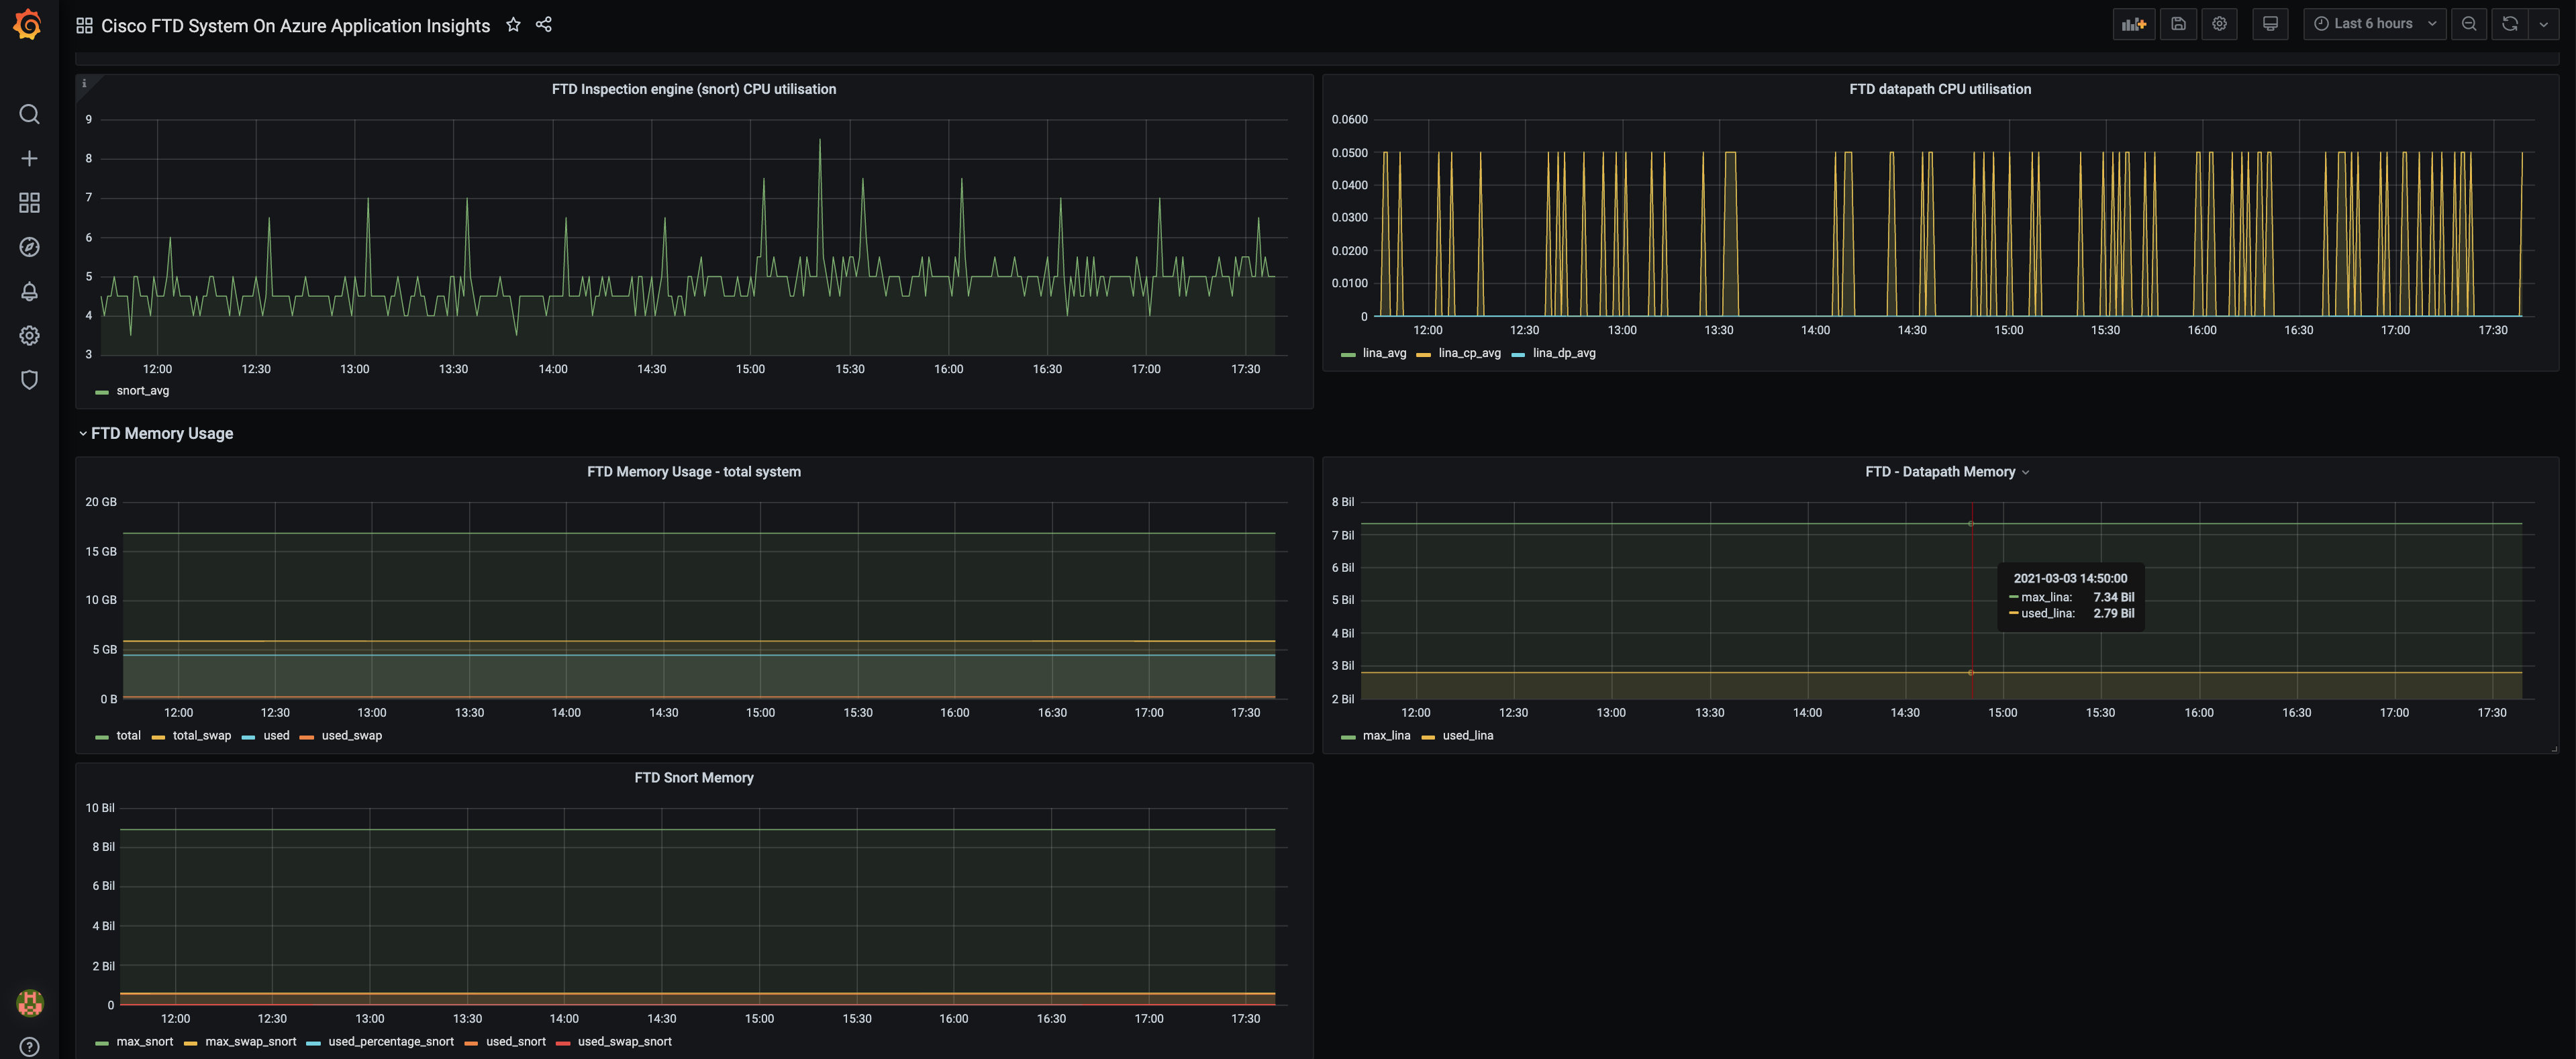
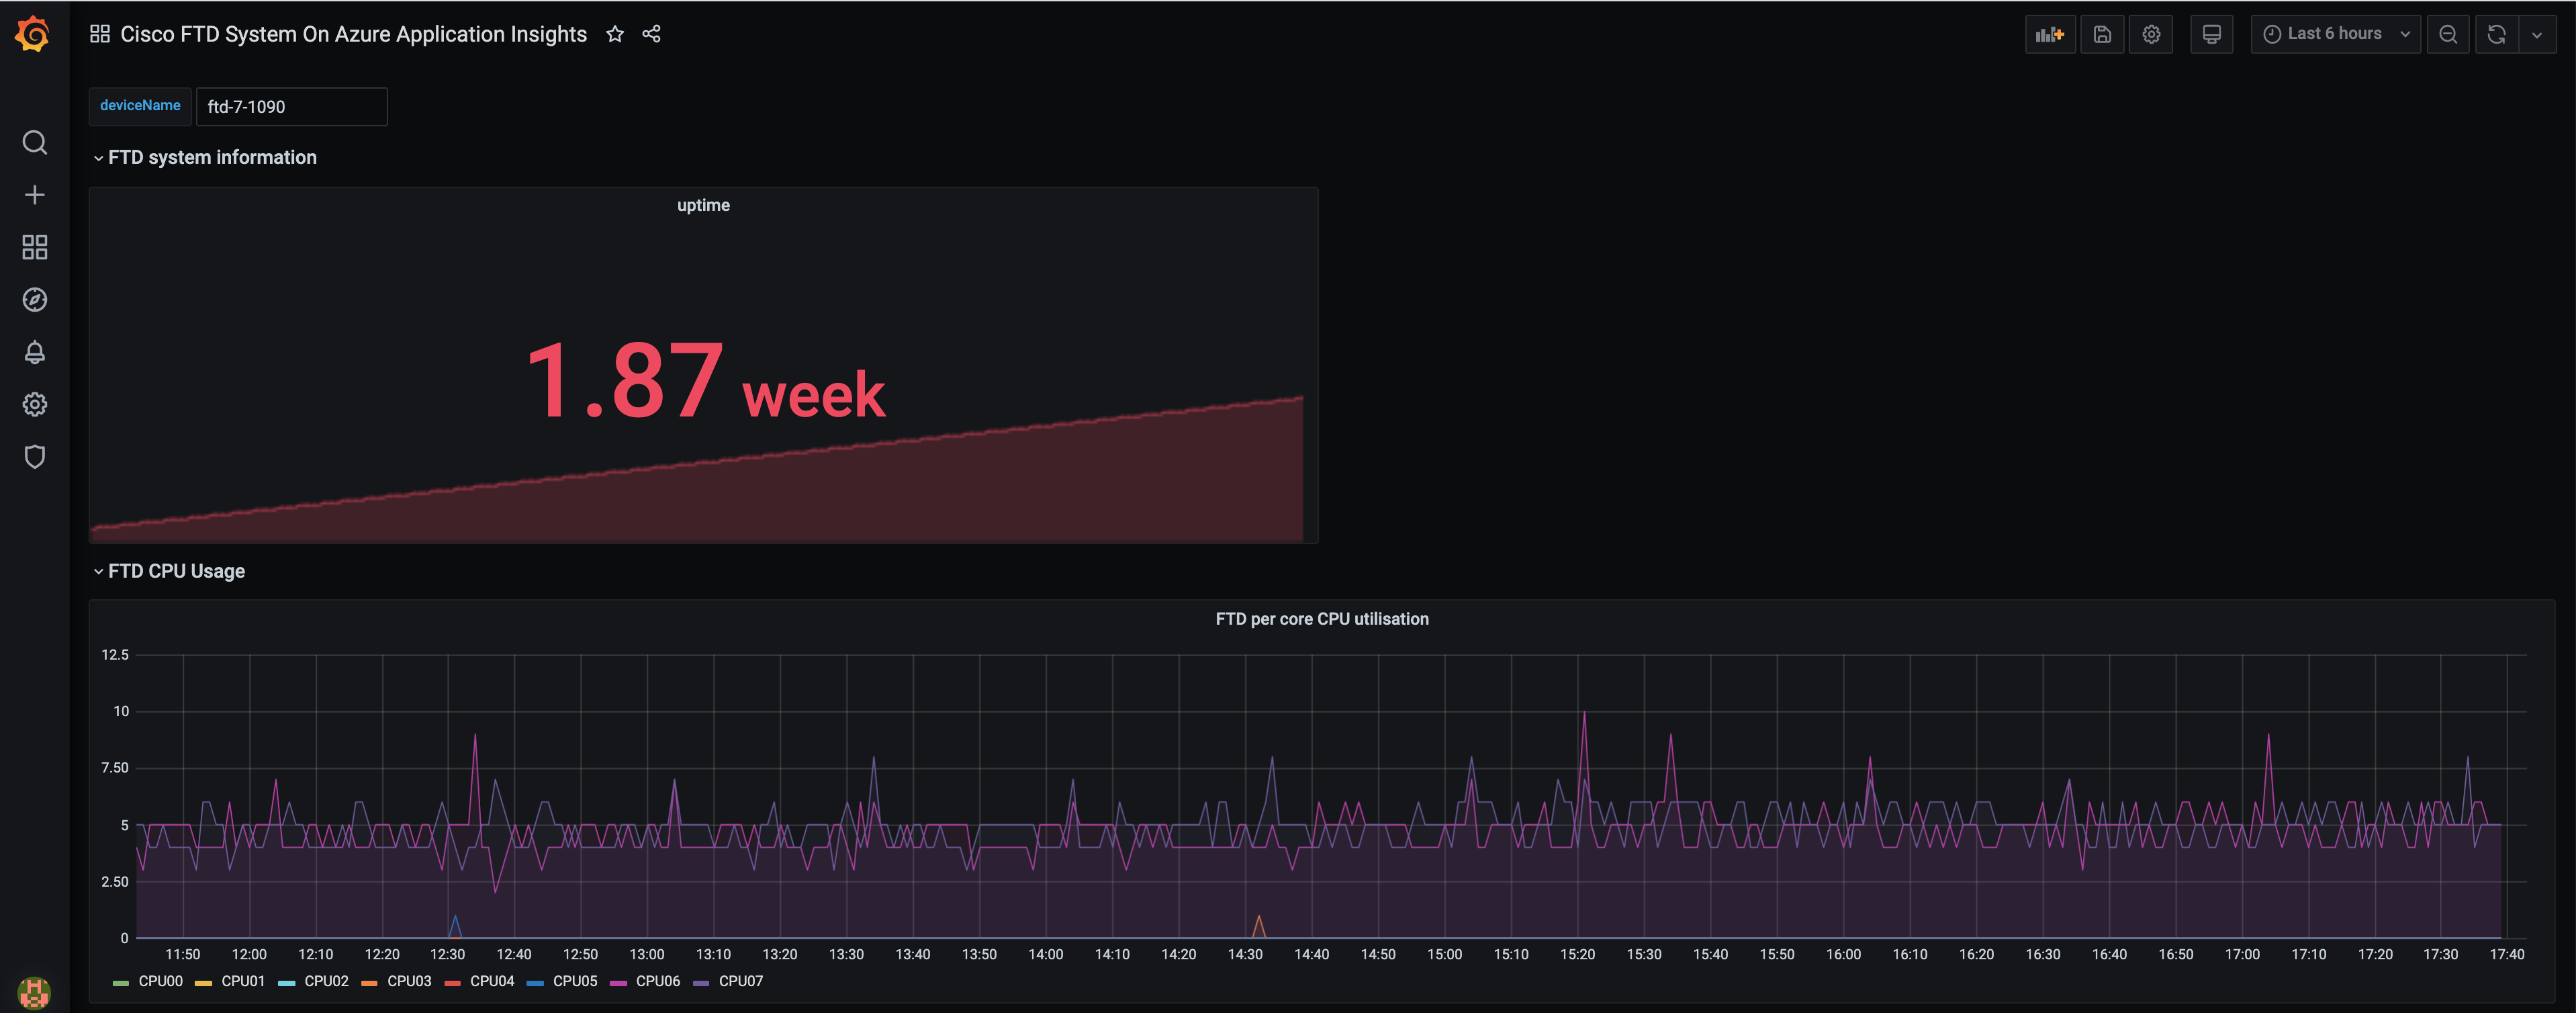
Cisco Firepower Threat Defence device can be configured to emit metrics to Azure Application Insights. This feature will be available to Cisco FTD customers in second half of calendar year 2021. The customers can monitor these metrics on this grafana dashboard by pointing the grafana dashboard to Azure Application Insight instance. To do that:
- Download and start Grafana
- On Grafana application, Go to Configure data source - Azure Monitor.
- Go to "Azure Application Insights Details" in the data source settings.
- Fill in the "API Key" and "Application Id" obtained from Azure Application Insights dashboard.
- In the dashboard, just fill in "deviceName" of the device you want to monitor and you will start receiving metrics for given device on the dashboard.
Data source config
Collector type:
Collector plugins:
Collector config:
Revisions
Upload an updated version of an exported dashboard.json file from Grafana
| Revision | Description | Created | |
|---|---|---|---|
| Download |
Azure Cosmos DB
With the Grafana plugin for Azure Cosmos DB, you can quickly visualize and query your Azure Cosmos DB data from within Grafana.
Learn more