Veeam ONE - Veeam Backup and Replication
Grafana Dashboard for Veeam ONE (experimental) - This specific Dashboard is to visualize the Veeam Backup and Replication data that Veeam ONE has on the Database.
EXPERIMENTAL AND UNSUPPORTED Just download the latest Veeam ONE script version from GitHub https://raw.githubusercontent.com/jorgedlcruz/veeam-one-grafana/main/veeam_one.sh and change the Configuration section within your details:
veeamInfluxDBURL="YOURINFLUXSERVER" ##Use https://fqdn or https://IP in case you use SSL
veeamInfluxDBPort="8086" #Default Port
veeamInfluxDB="YOURINFLUXDB" #Default Database
veeamInfluxDBUser="YOURINFLUXUSER" #User for Database
veeamInfluxDBPassword="YOURINFLUXPASS" #Password for Database
Endpoint URL for login action
veeamUsername="YOURVEEAMONEUSER" #Usually domain\user or user@domain.tld
veeamPassword="YOURVEEAMONEPASS"
veeamONEServer="https://YOURVEEAMONEIP" #You can use FQDN if you like as well
veeamONEPort="1239" #Default Port
Once the changes are done, make the script executable with chmod:
chmod +x veeam_one.sh
The output of the command should be something like the next, without errors:
Writing veeam_ONE_repositories to InfluxDB
HTTP/1.1 204 No Content
Content-Type: application/json
Request-Id: 9e9c517e-7a11-11eb-8acb-0050569017a8
X-Influxdb-Build: OSS
X-Influxdb-Version: 1.8.4
X-Request-Id: 9e9c517e-7a11-11eb-8acb-0050569017a8
Date: Sun, 28 Feb 2021 22:09:25 GMT
If so, please now add this script to your crontab, like for example every 30 minutes:
*/30 * * * * /home/oper/veeam_one.sh >> /var/log/veeamone.log 2>&1
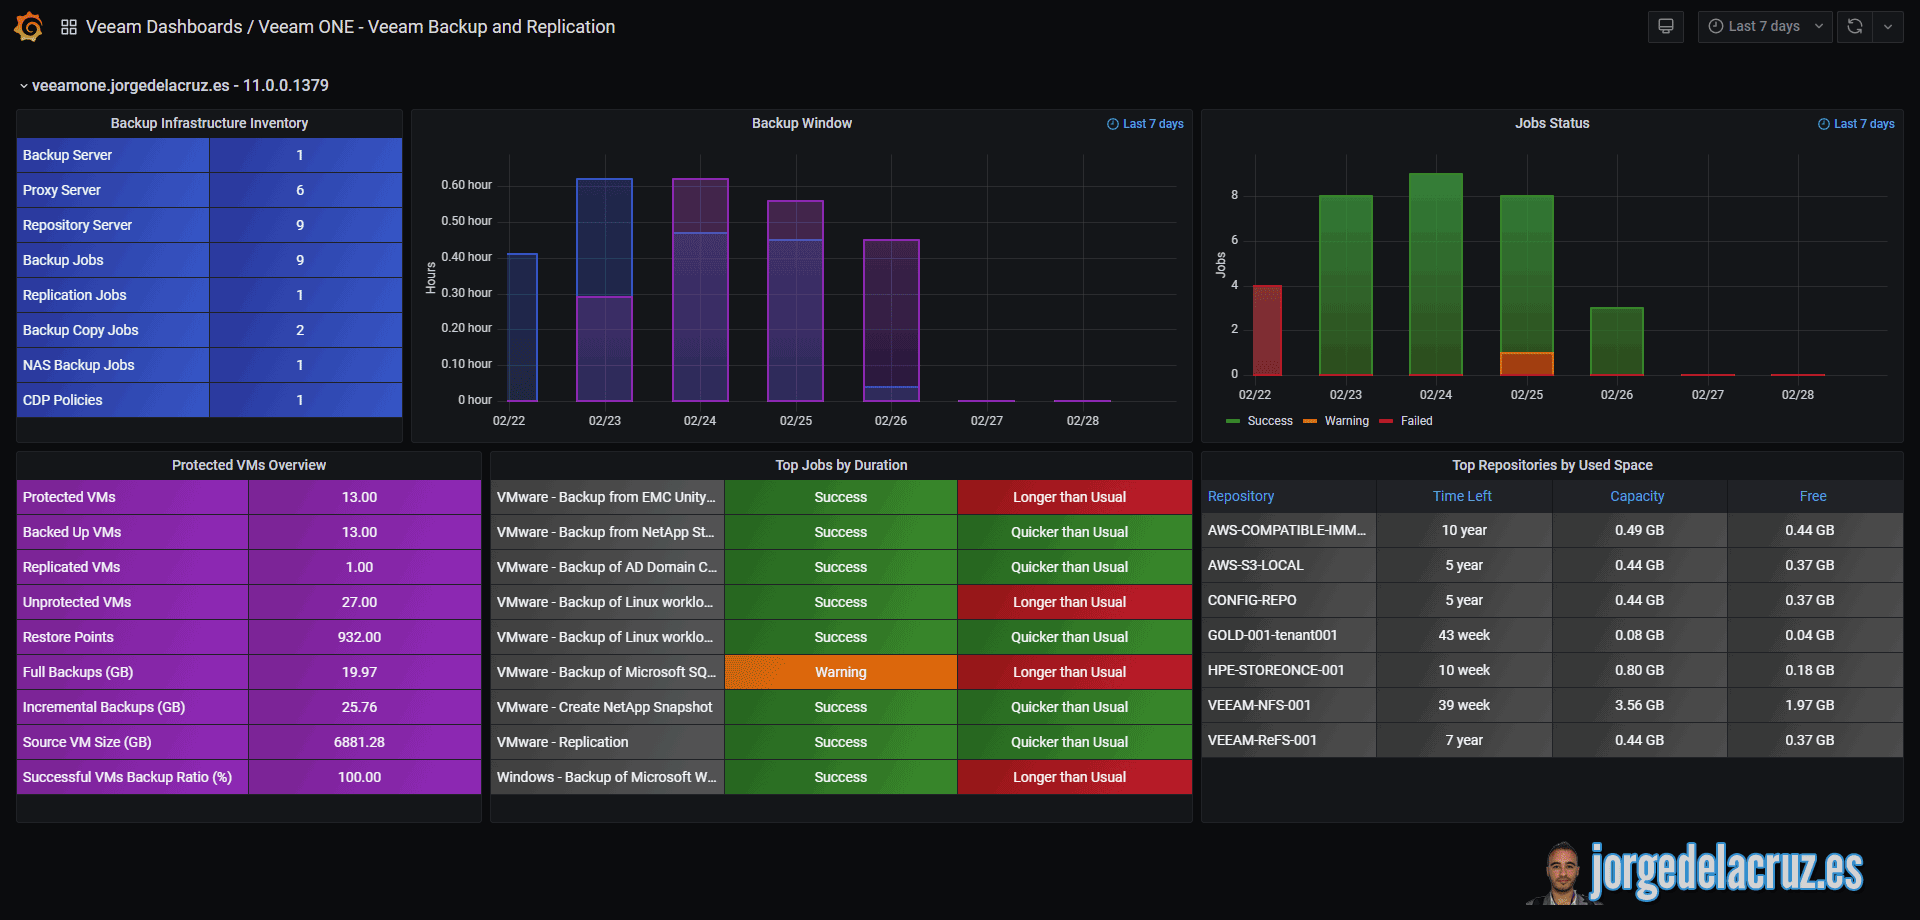
Then download or import this Dashboard to your Grafana, and you should see something similar to the next:

Data source config
Collector config:
Upload an updated version of an exported dashboard.json file from Grafana
| Revision | Description | Created | |
|---|---|---|---|
| Download |