Akka.NET Cluster + Phobos Metrics (Influx Data Source)
System-wide Akka.Cluster metrics used for profiling Akka.NET performance
DEPRECATED
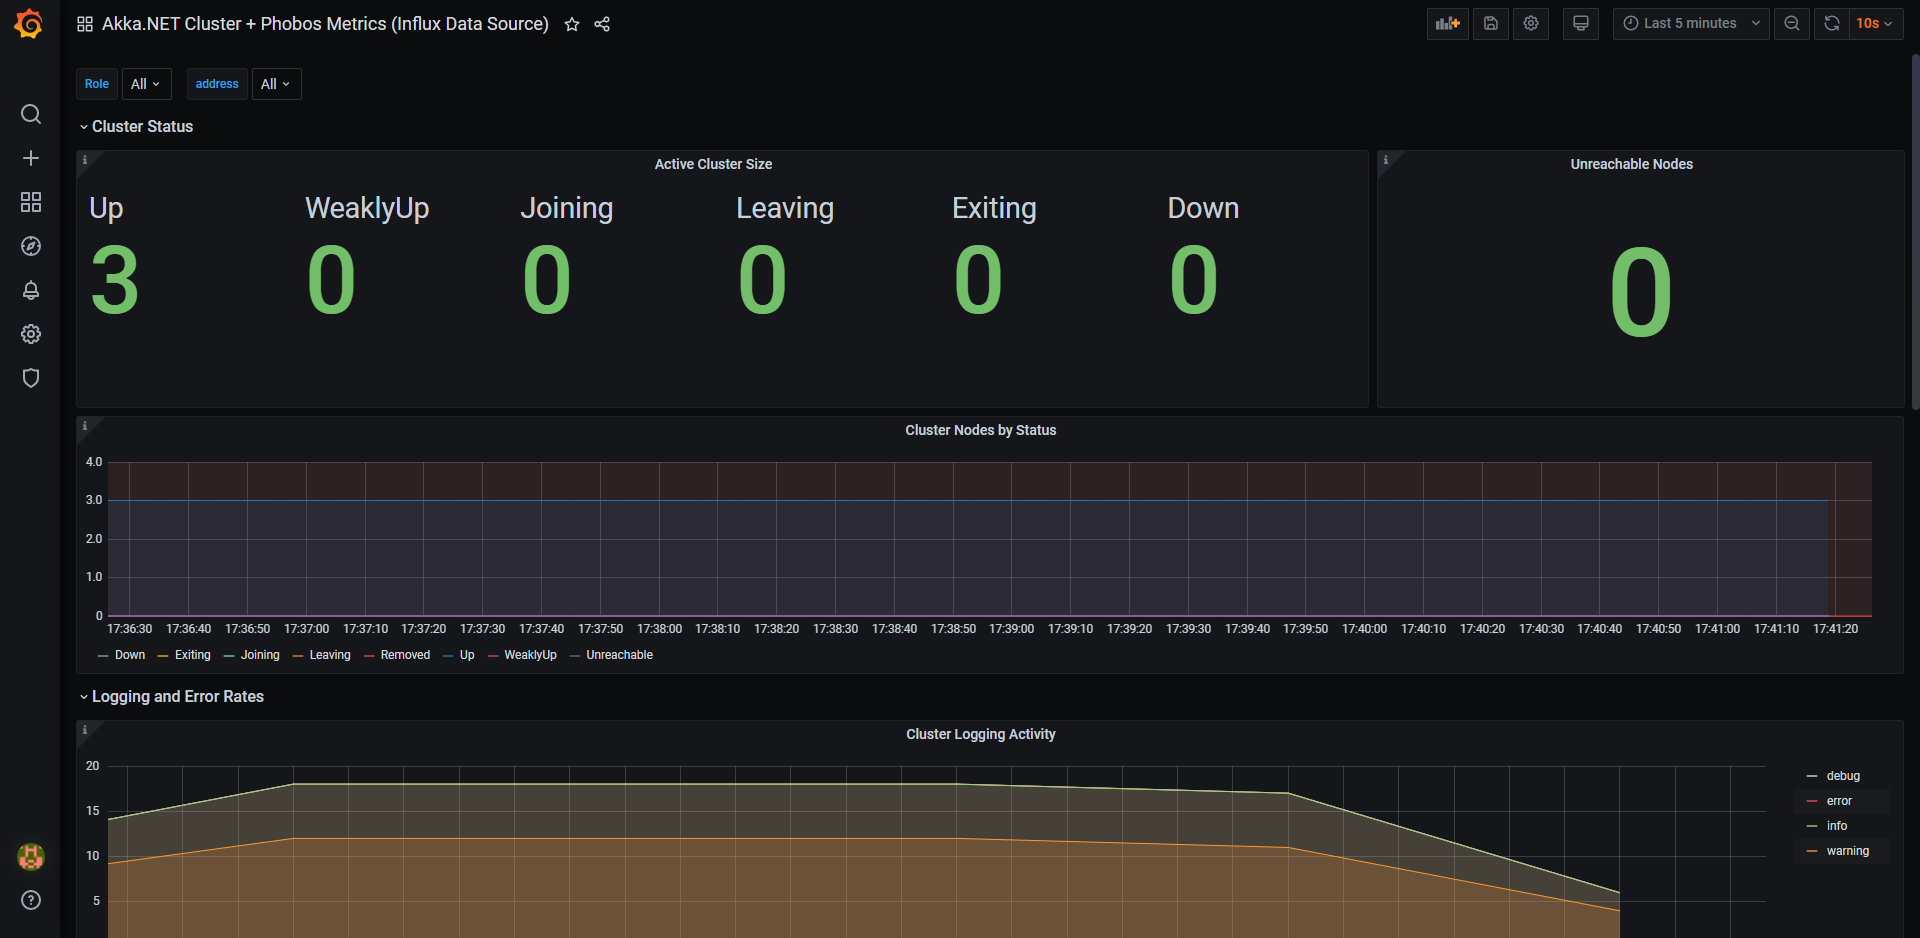
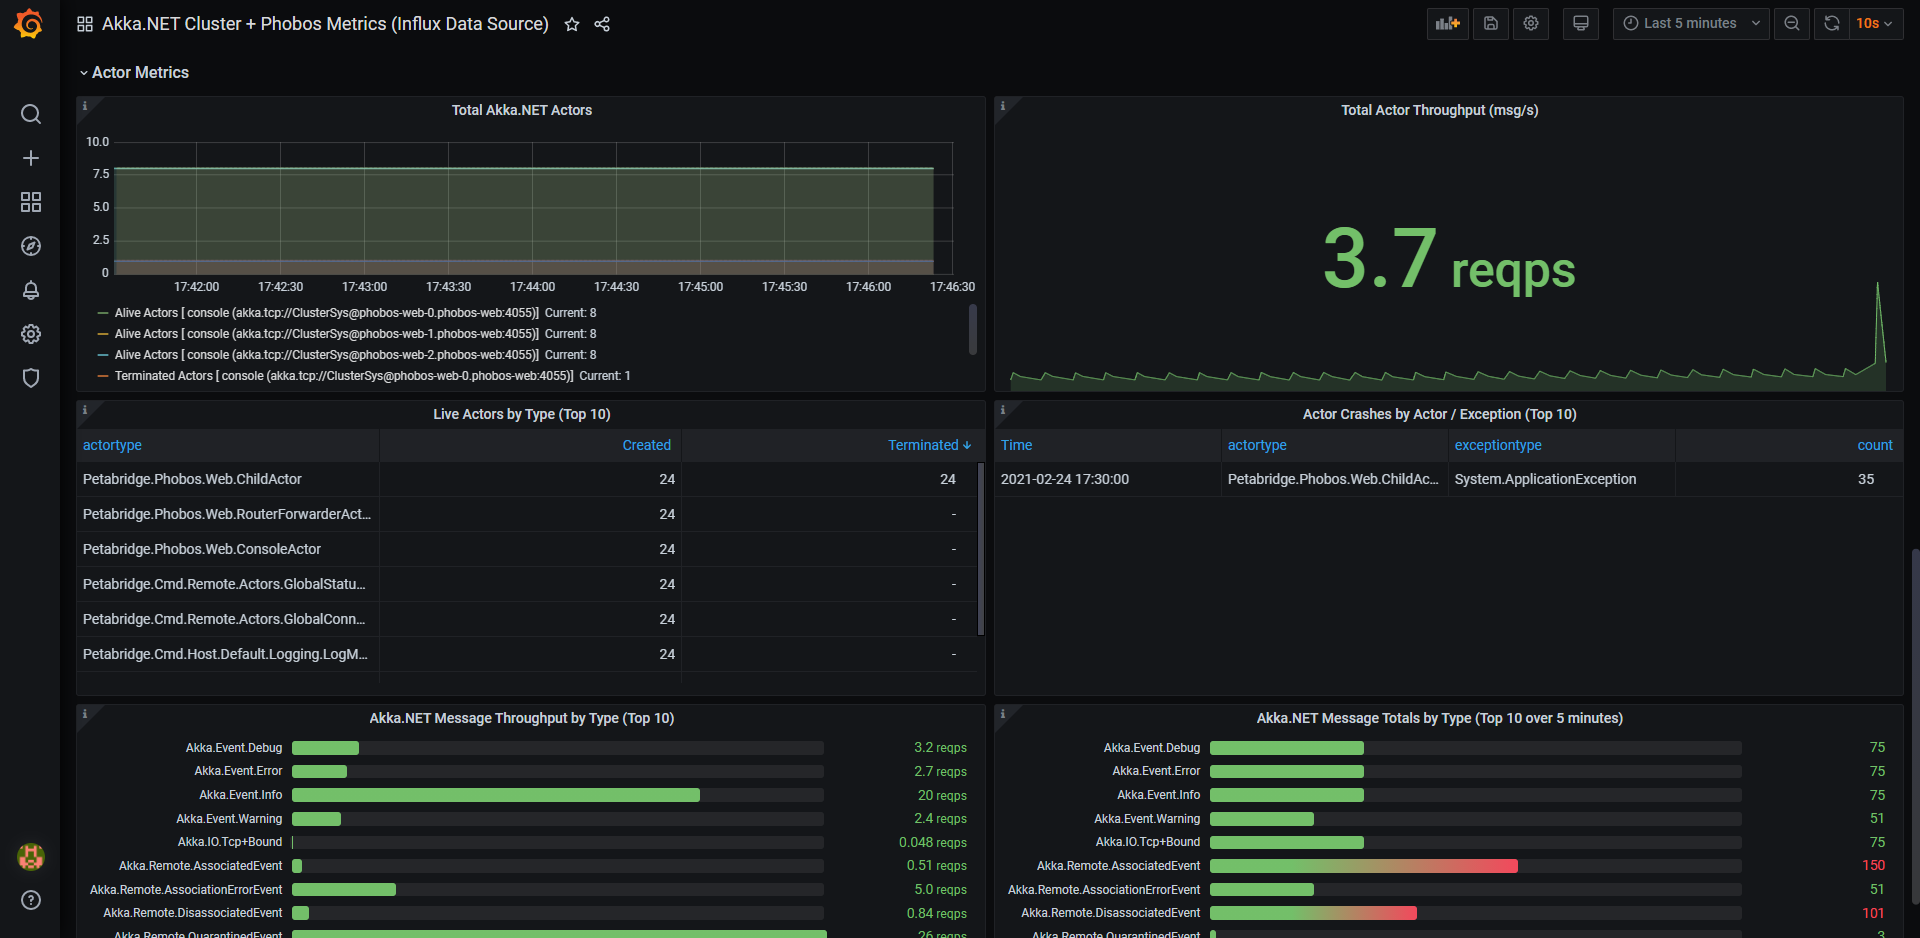
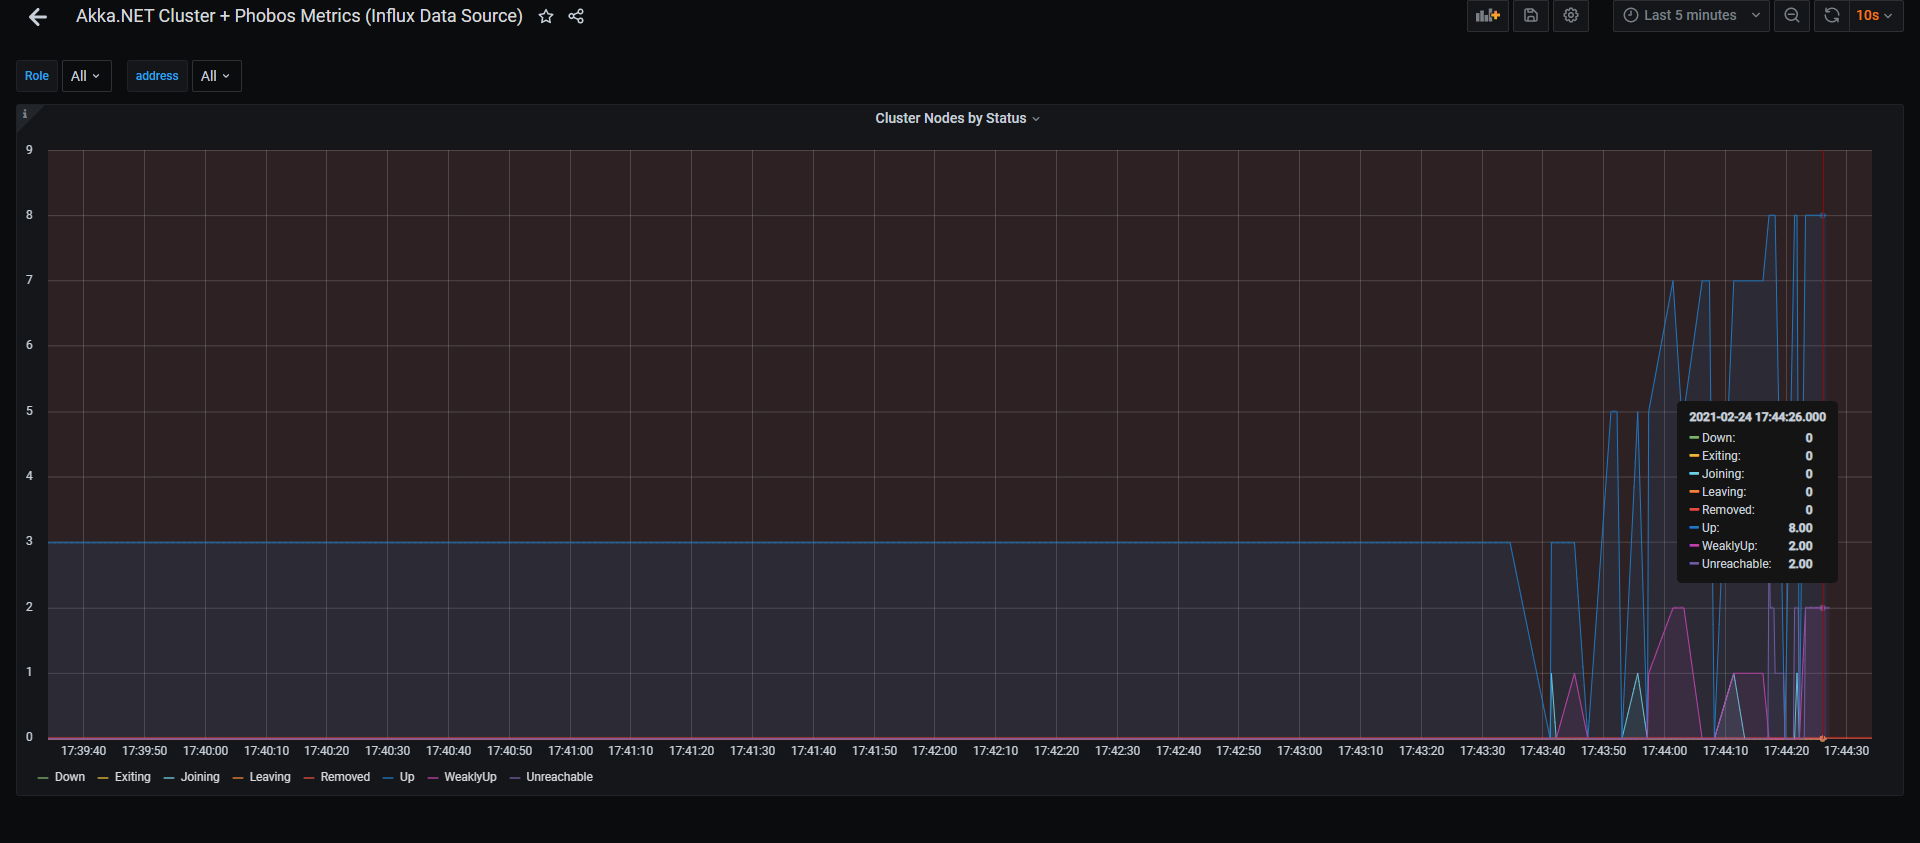
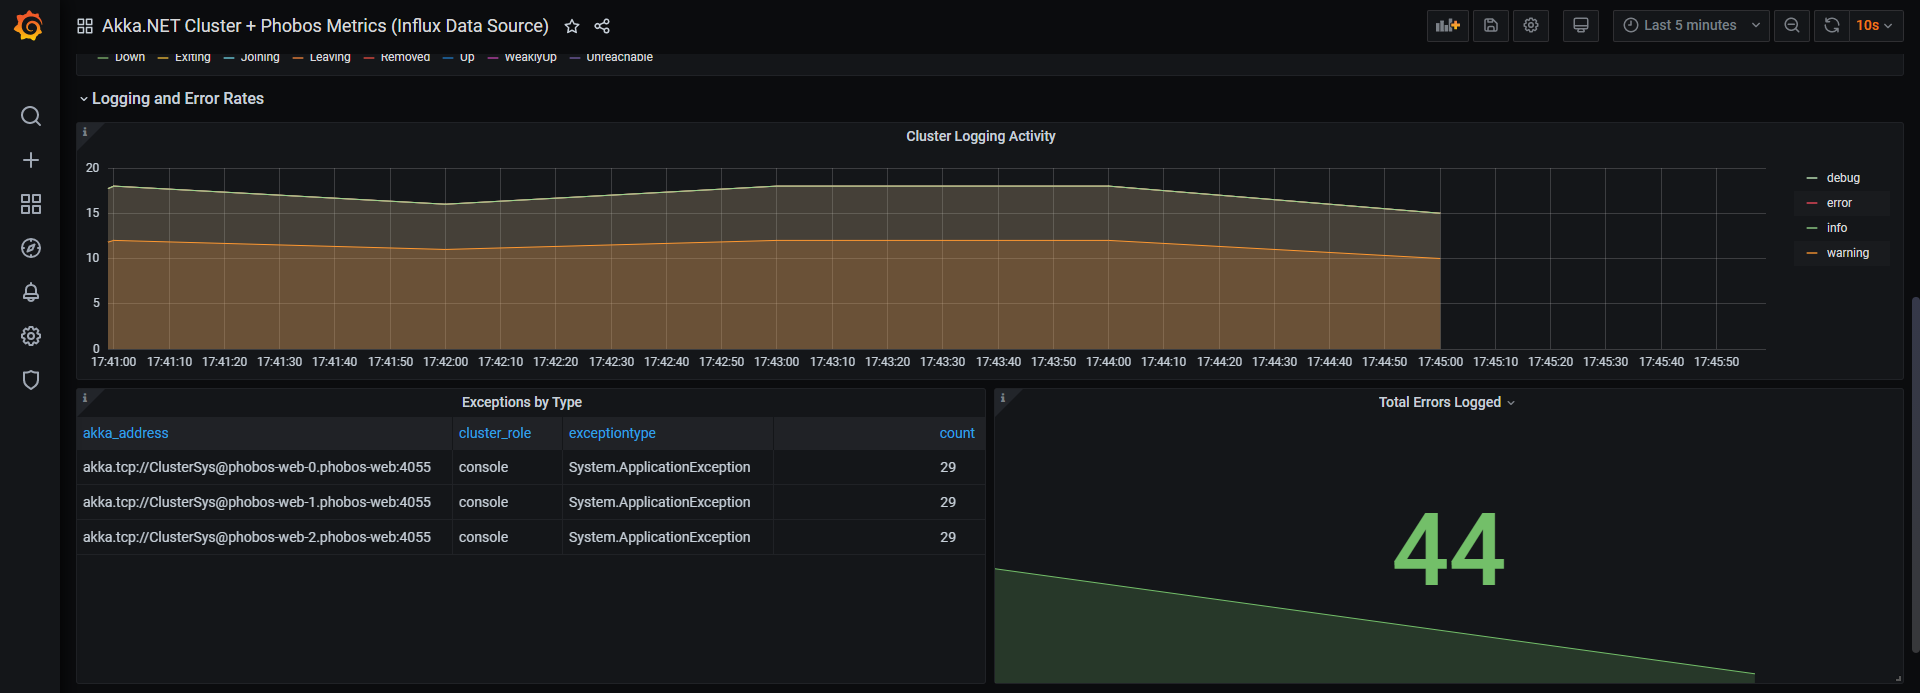
This dashboard is used to visualize Akka.NET clusters, the number of running actors, the messages they process, the logging / error rates, and more.
It's designed to consume data from the Phobos Akka.NET APM library and will automatically format the data produced natively by Phobos into the charts without any additional effort. All this dashboard requires is a Prometheus instance that is accessible via Grafana and Phobos.
Dashboard Issues & Improvements: you can submit requests and tickets to improve this Akka.NET + Phobos dashboard here: https://github.com/petabridge/phobos-dashboards
Data source config
Collector type:
Collector plugins:
Collector config:
Revisions
Upload an updated version of an exported dashboard.json file from Grafana
| Revision | Description | Created | |
|---|---|---|---|
| Download |