Microsoft SQL Server
Works with and awaragi/prometheus-mssql-exporter
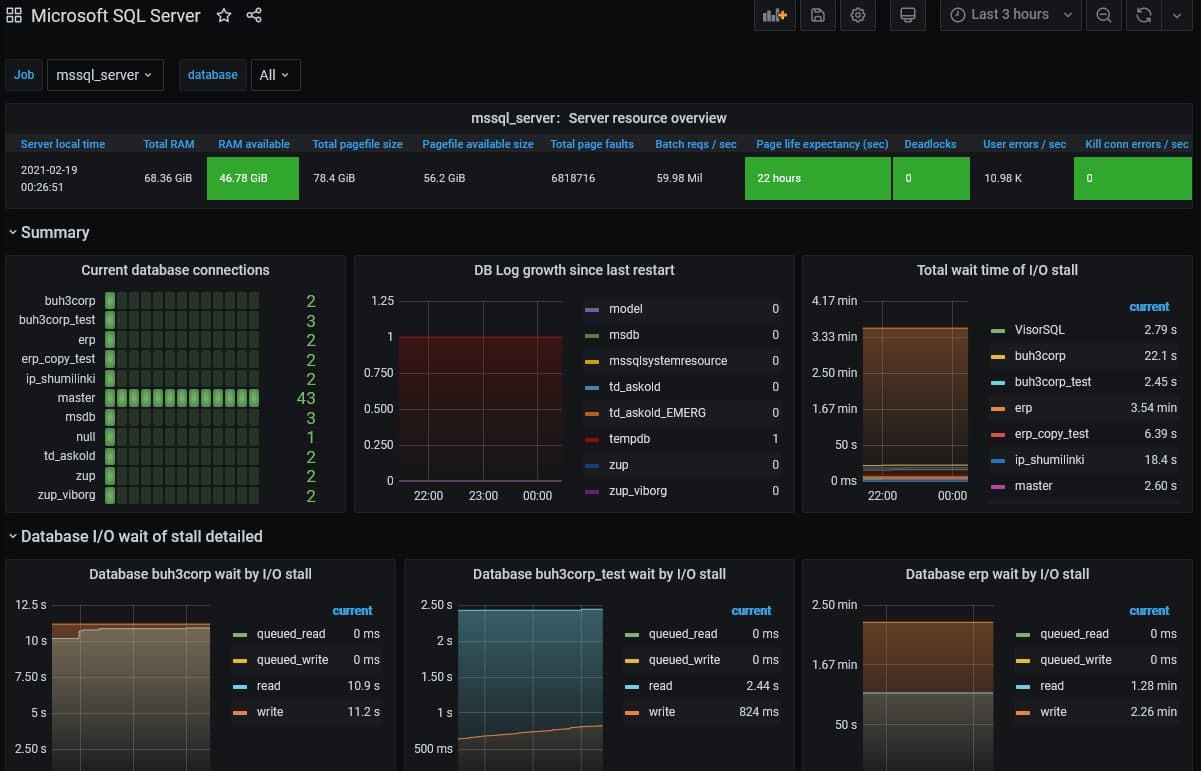
A bit raw but usable dashboard to monitor your MS SQL Server Instance
Data source config
Collector type:
Collector plugins:
Collector config:
Revisions
Upload an updated version of an exported dashboard.json file from Grafana
| Revision | Description | Created | |
|---|---|---|---|
| Download |
Microsoft Azure Observability
Easily visualize and alert on Microsoft Azure Service resources using the fully managed Grafana Cloud platform.
Learn more