Palo Alto Firewalls
PaloAlto PANOS
This dashboard is populated using SNMP OIDs. I created 3 sections for the dashboard
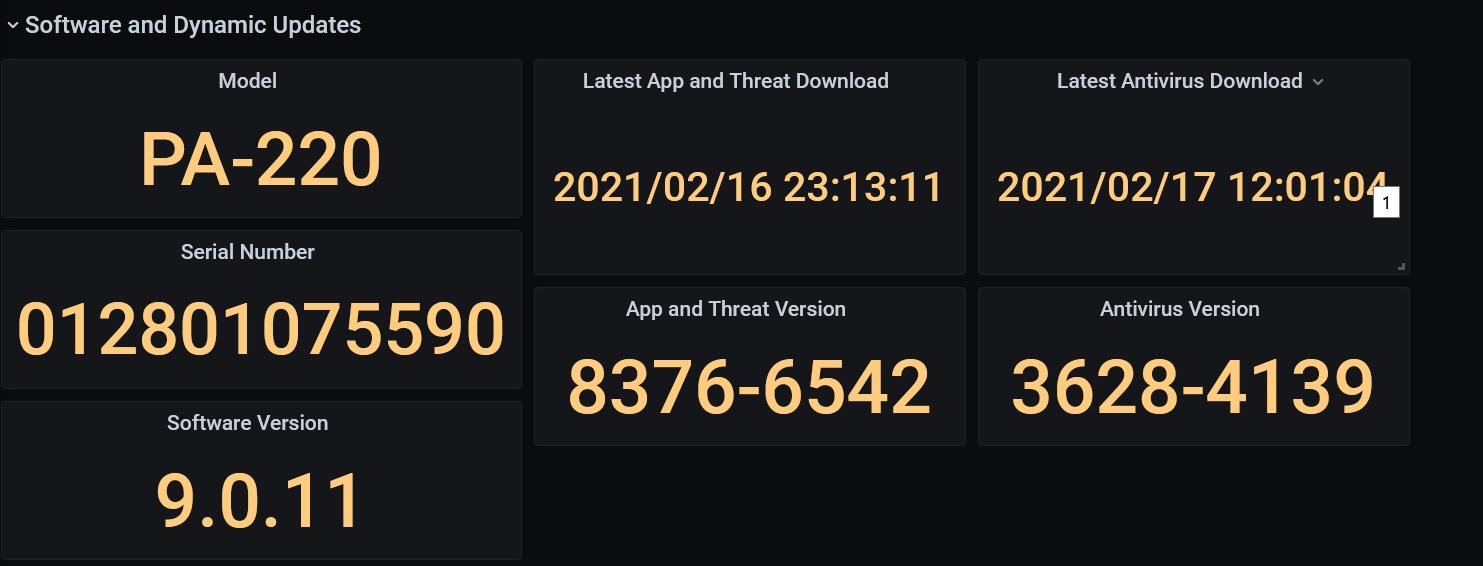
- Software and Dynamic Updates: Displays model number, serial number, panos version and threat versions
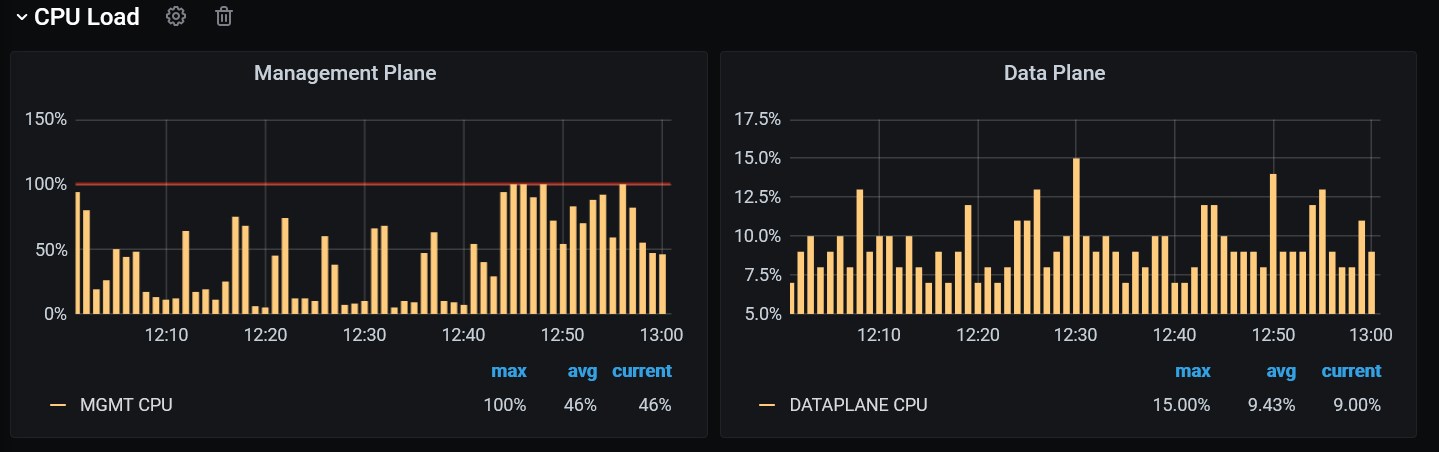
- CPU Load: Graph showing mgmt and data plane CPU Utilization
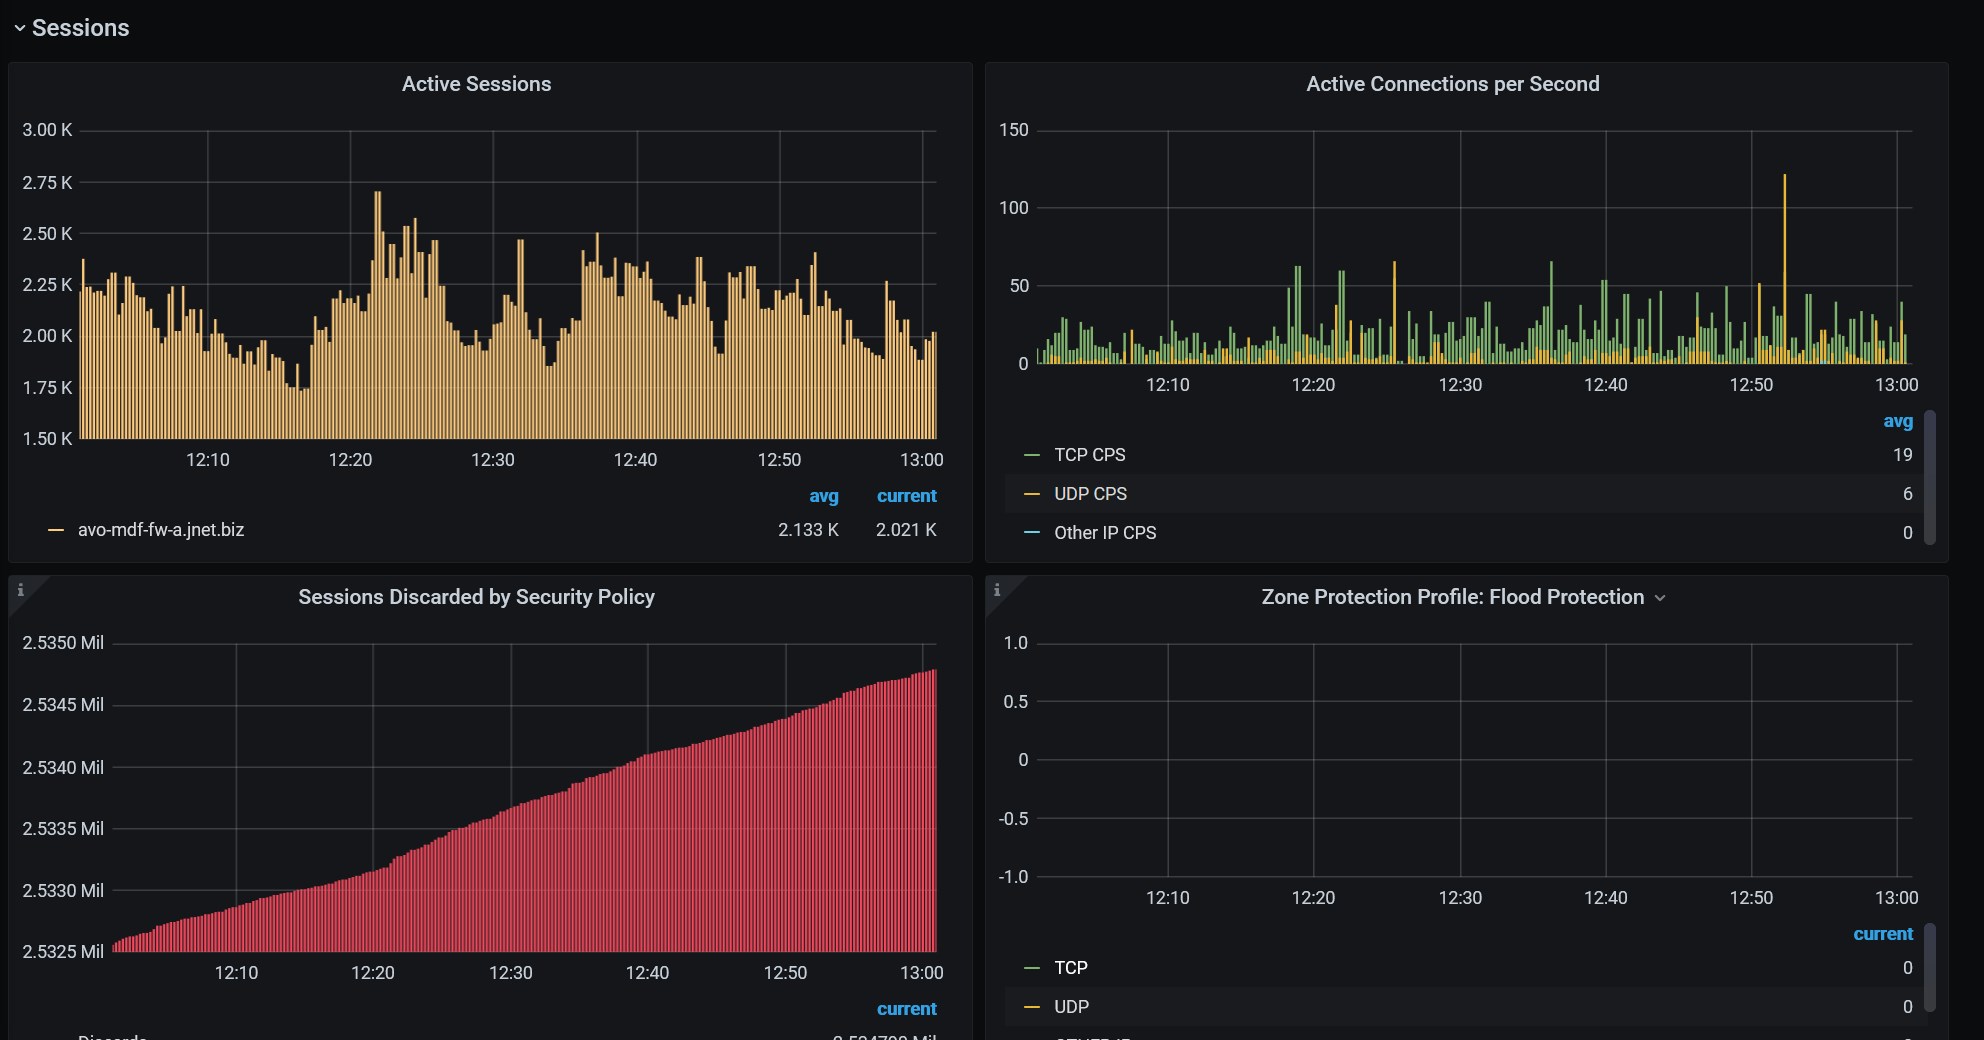
- Session Info: Active sessions, connections-per-second, DoS_Flood Protection graphs
Data source config
Collector type:
Collector plugins:
Collector config:
Revisions
Upload an updated version of an exported dashboard.json file from Grafana
| Revision | Description | Created | |
|---|---|---|---|
| Download |