
k6.io metrics with statsd_exporter and Prometheus
k6.io load tests results
Overview
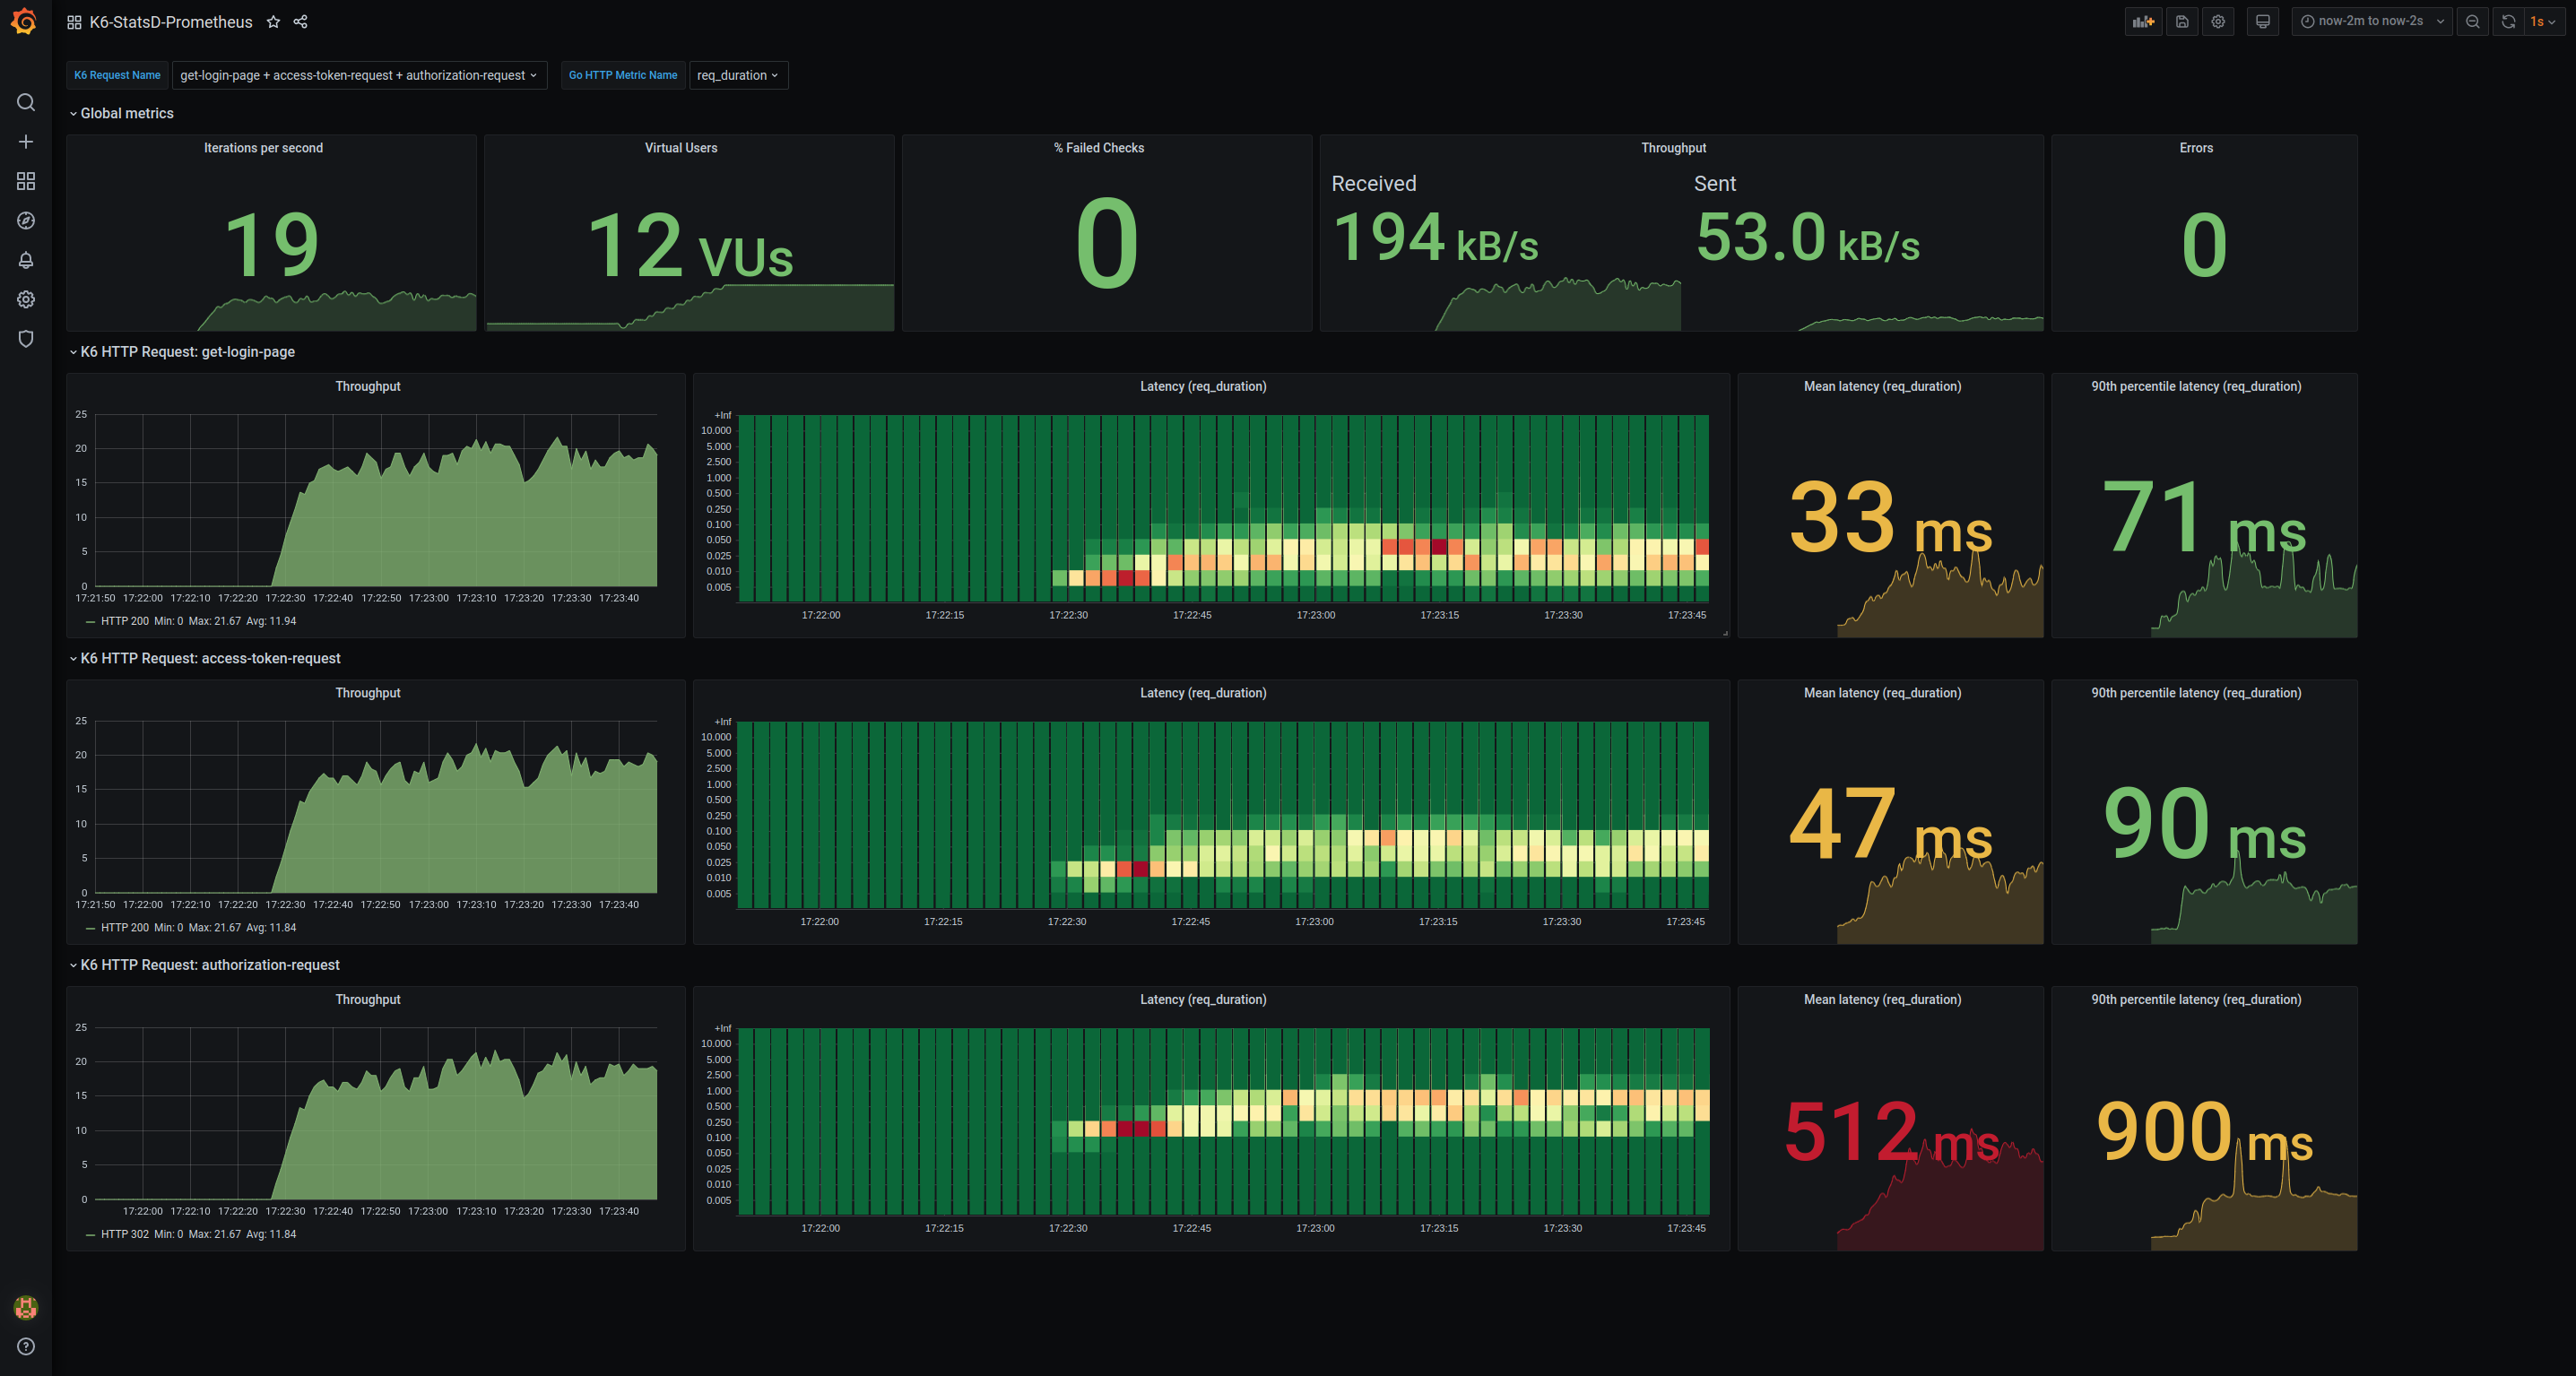
The dashboard is divided in three parts:
- the variables panel
- the global metrics panel
- a panel for each HTTP request
Through the variables panel, you can choose to observe one or multiple specific HTTP requests (tracked by their “name” tag). You can then choose which HTTP timing to observe amongst the seven standard Go HTTP timings.
The global metrics panel provides an overview of the running test:
- Number of test iterations per second
- Number of Virtual Users scheduled
- Percentage of failed checks
- Network throughput (number of bytes sent and received per second)
- Number of script errors
A panel is instantiated for each K6 request name that the user enabled in the K6 Request Name dropdown list. The request panel shows throughput and latencies for each selected request:
- Number of HTTP requests per second, grouped by HTTP status code
- Heatmap of the request latencies over time
- Mean latency with threshold at 20 ms and 200 ms
- 90th percentile latency with threshold at 100 ms and 1000 ms
Setup
More information on how to setup the whole stack in this article: How to run performance tests with K6, Prometheus and Grafana
Data source config
Collector config:
Dashboard revisions
Upload an updated version of an exported dashboard.json file from Grafana
| Revision | Decscription | Created | |
|---|---|---|---|
| Download |
Get this dashboard
Data source:
Dependencies: