
Internet Dashboard Prometheus
Monitor FRITZ!Box routers using prometheus and fritzbox_exporter
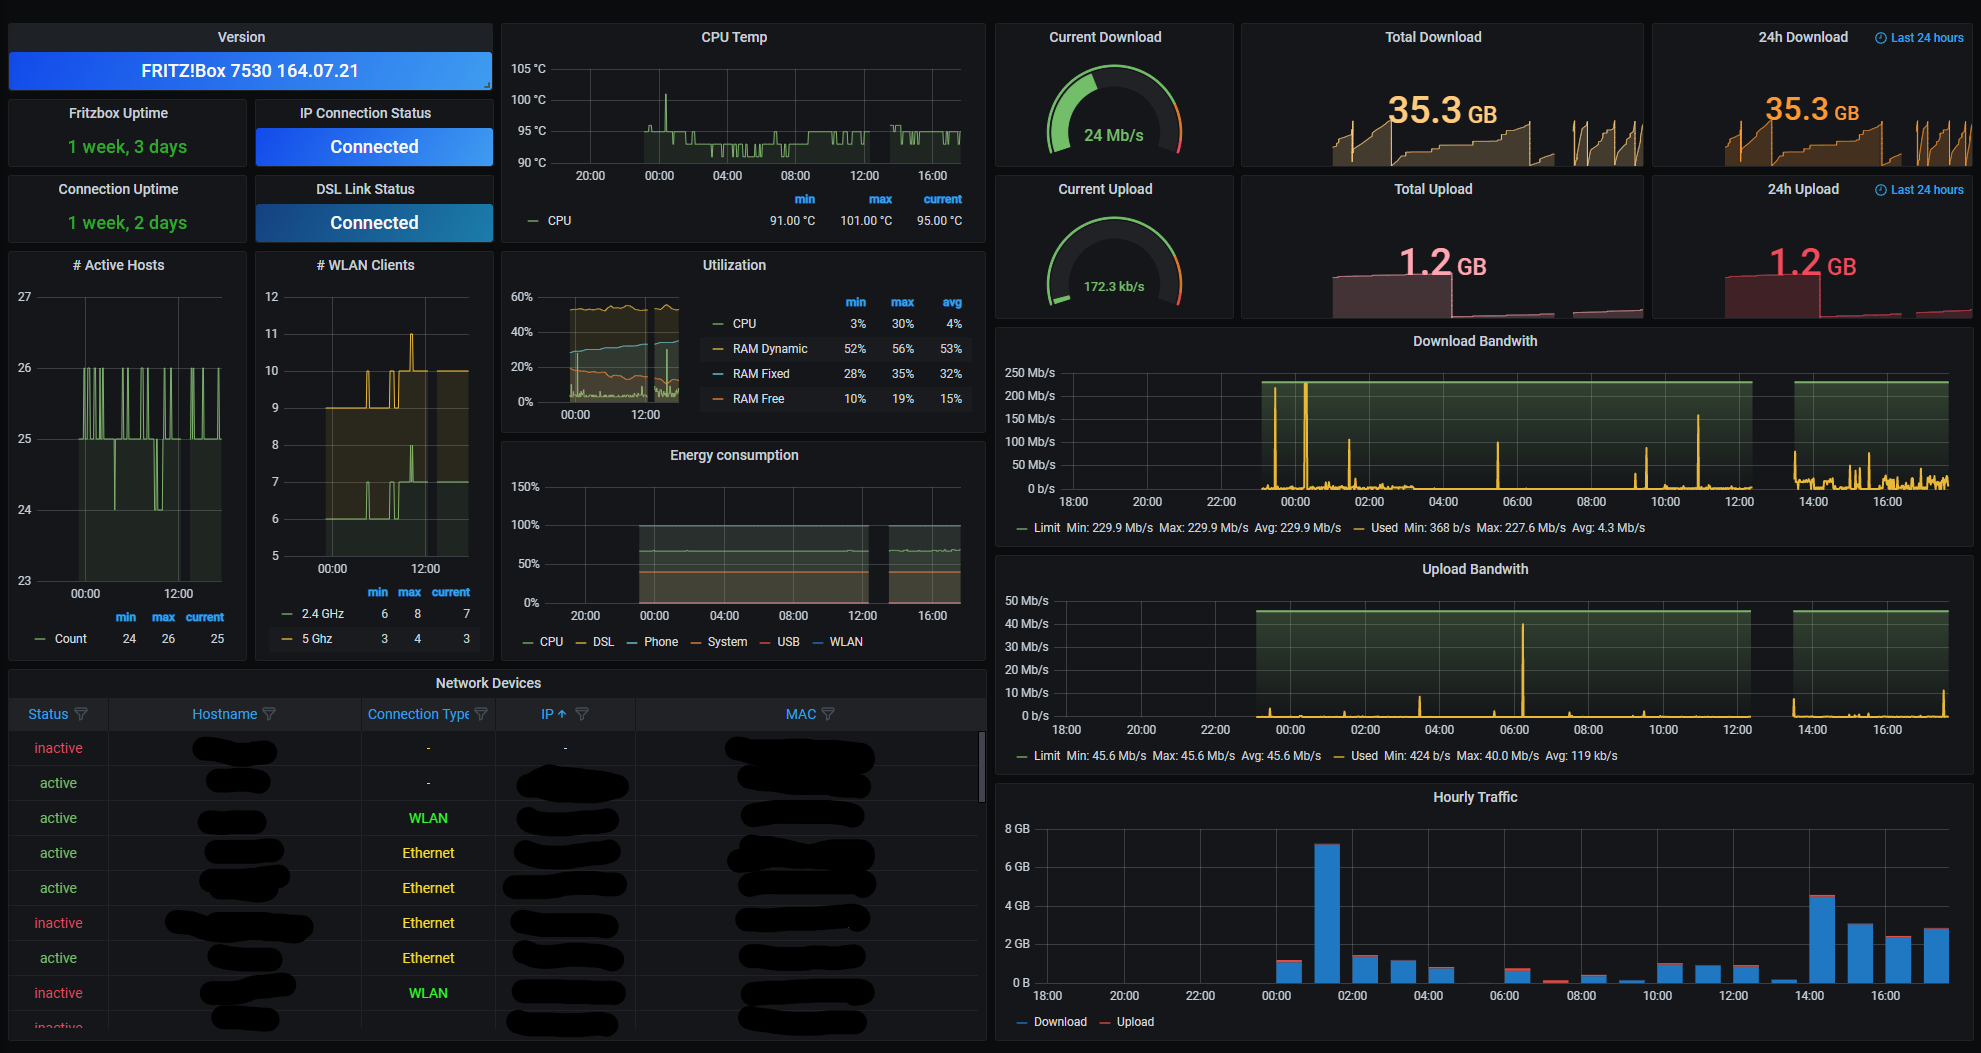
The Internet Dashboard Prometheus dashboard uses the prometheus data source to create a Grafana dashboard with the gauge, graph, stat and table panels.
Data source config
Collector type:
Collector plugins:
Collector config:
Revisions
Upload an updated version of an exported dashboard.json file from Grafana
| Revision | Description | Created | |
|---|---|---|---|
| Download |
Metrics Endpoint (Prometheus)
Easily monitor any Prometheus-compatible and publicly accessible metrics URL with Grafana Cloud's out-of-the-box monitoring solution.
Learn moreGet this dashboard
Resources