
Netdata: MongoDB Overview
Detailed stats for MongoDB (queries, cache, locks, etc)
About dashboard
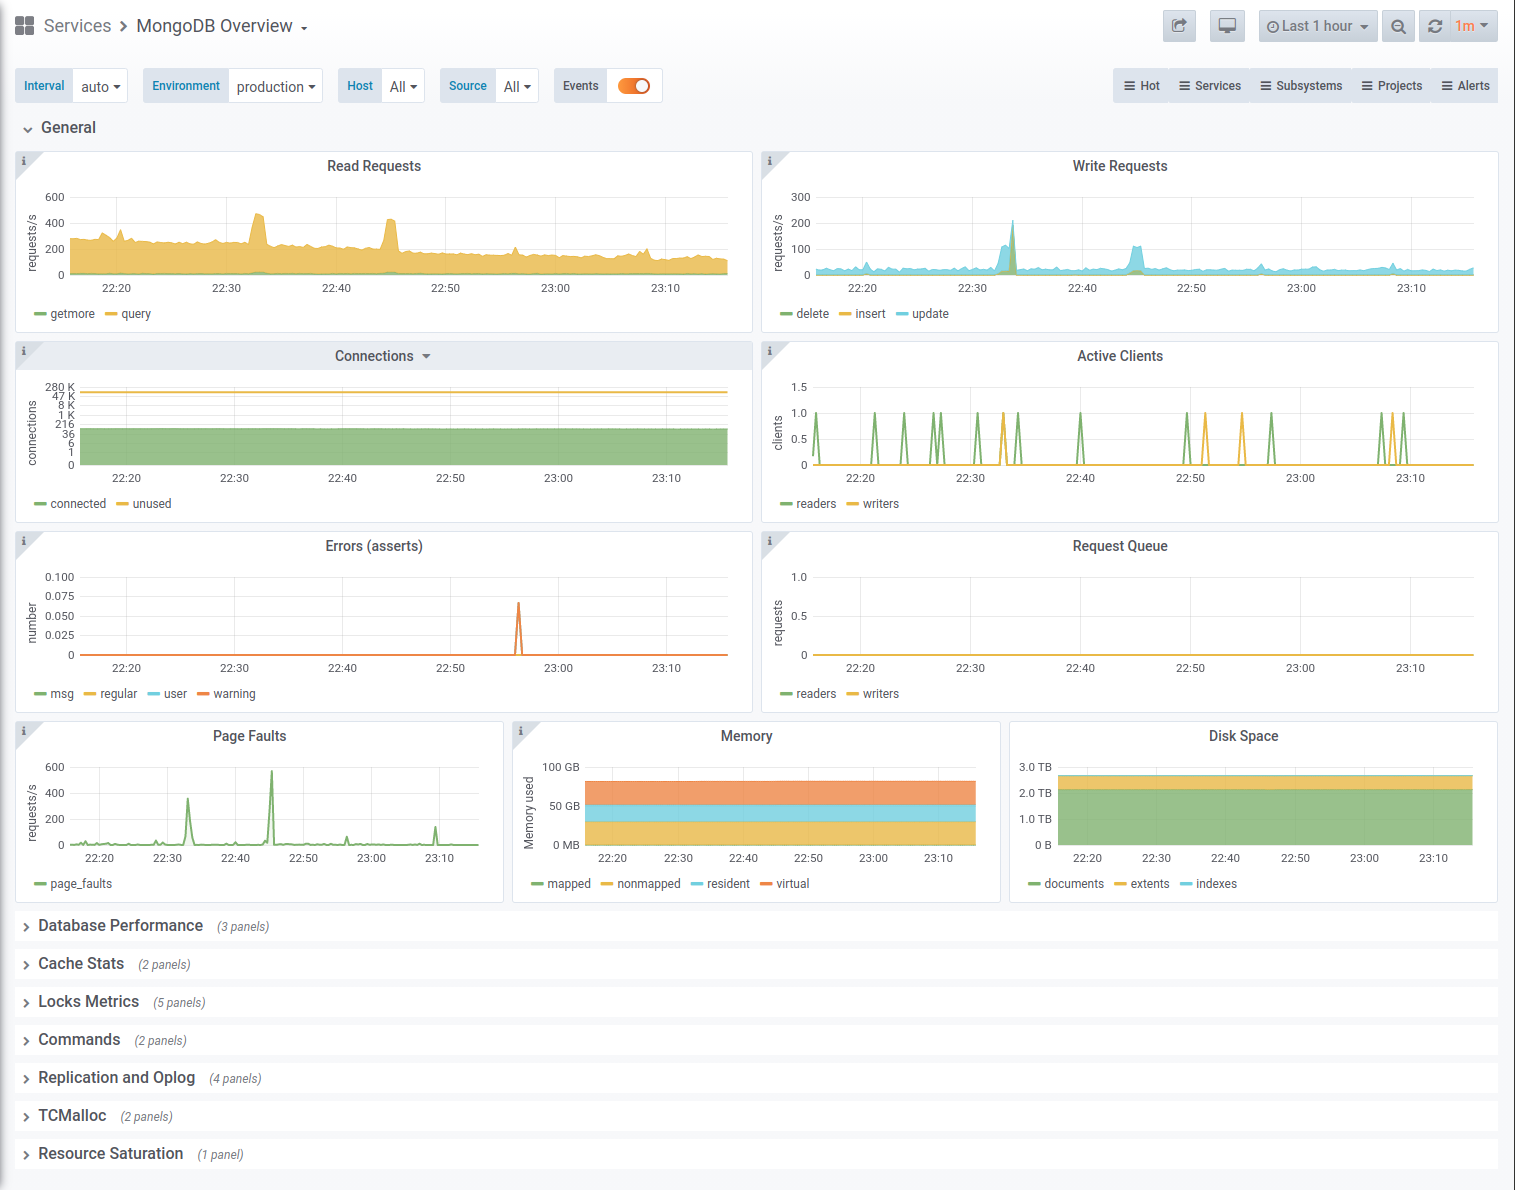
A dashboard with an overview for MongoDB metrics:
- Read and write requests
- Connections and clients (read, write)
- Request queues (read, write)
- Errors by type
- Memory and disk usage
- Cache Stats (wiredtiger and evictions)
- Locking Stats (colleciton, database, global, metadata, oplog)
- Commands rate by type (success, failed)
- ReplicaSet metrics (members, oplog, heartbeat)
- TCMalloc stats
More dashboards for Netdata you can find here.
How to use
Netdata setup
Follow these instructions to setup MongoDB monitoring in Netdata.
Prometheus setup
Please note that you need Netdata as an exporter for metrics. Plus, these labels are mandatory:
- job
- env
- instance
- group
- source
In your prometheus.yml it should look like this:
- job_name: netdata
  metrics_path: /api/v1/allmetrics?format=prometheus_all_hosts&source=raw
  relabel_configs:
  - source_labels: [__address__]
    regex: ^(.+)\.\w+:\d+
    target_label: instance
    action: replace
  static_configs:
  - targets: [netdata.hostname.here:19999]
    labels:
      env: production
      group: applications
source: newprojectWARNING: Without these labels, this dashboard won’t be fully functioning.
Links
License
GPL3
Author
OSSHelp Team, see https://oss.help
Data source config
Collector type:
Collector plugins:
Collector config:
Dashboard revisions
Upload an updated version of an exported dashboard.json file from Grafana
| Revision | Decscription | Created | |
|---|---|---|---|
| Download |
Sign up for Grafana Cloud

Get up and running in minutes with the Grafana Cloud free tier, which includes free forever 10k metrics, 50GB logs, 50GB traces, 500 VUh, and more.
Get this dashboard
Data source:
Dependencies: