njmon for AIX Experimental Graphs V14
Some new Graphs and Panels plus some experiments. Did you know you can cut and paste a panel between Dashboards
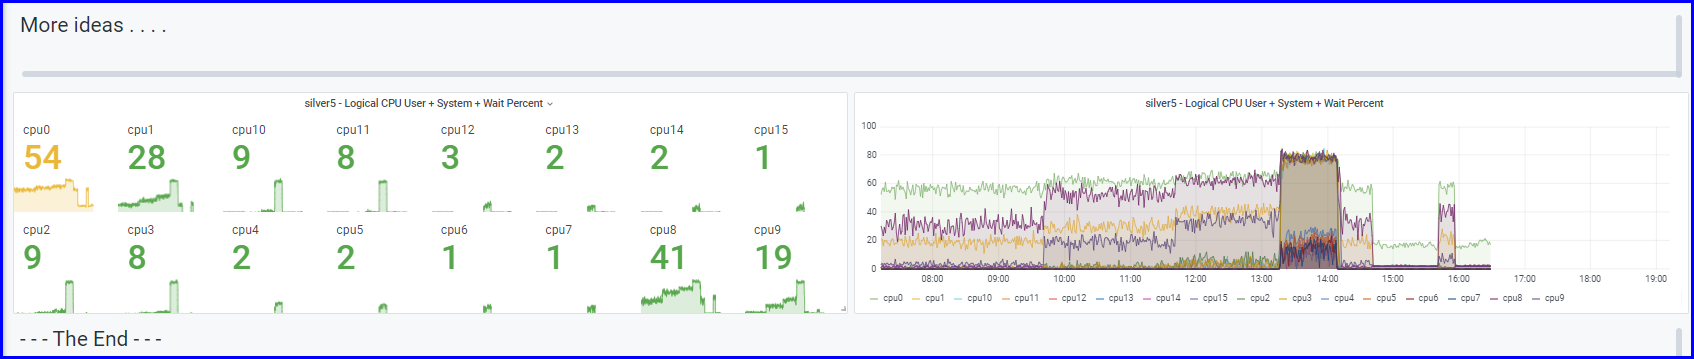
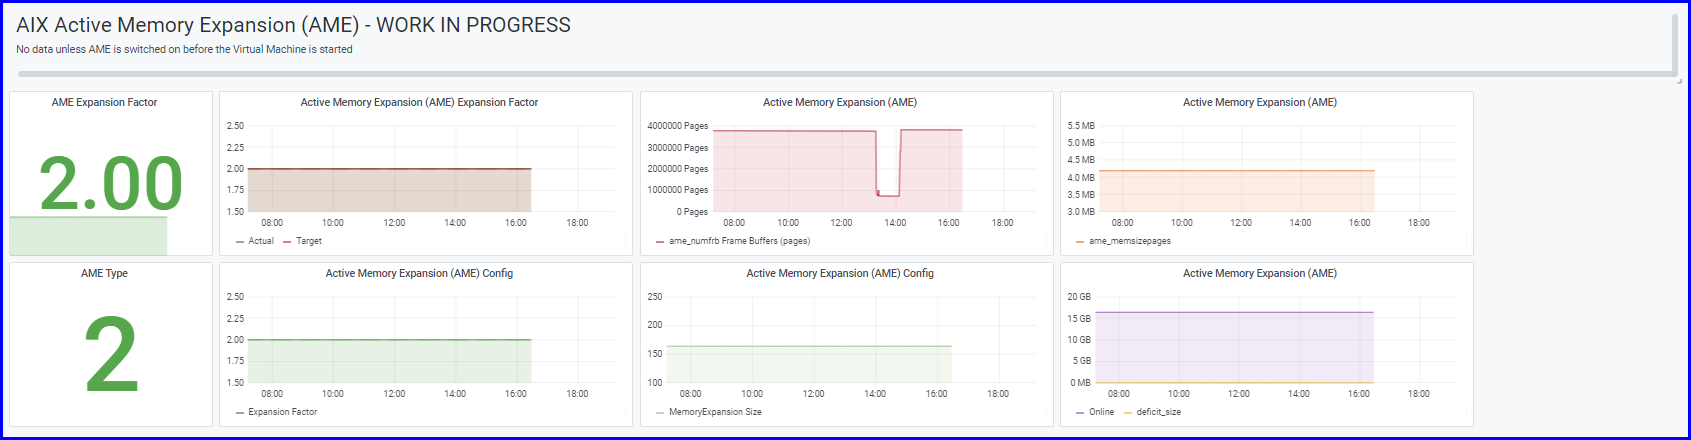
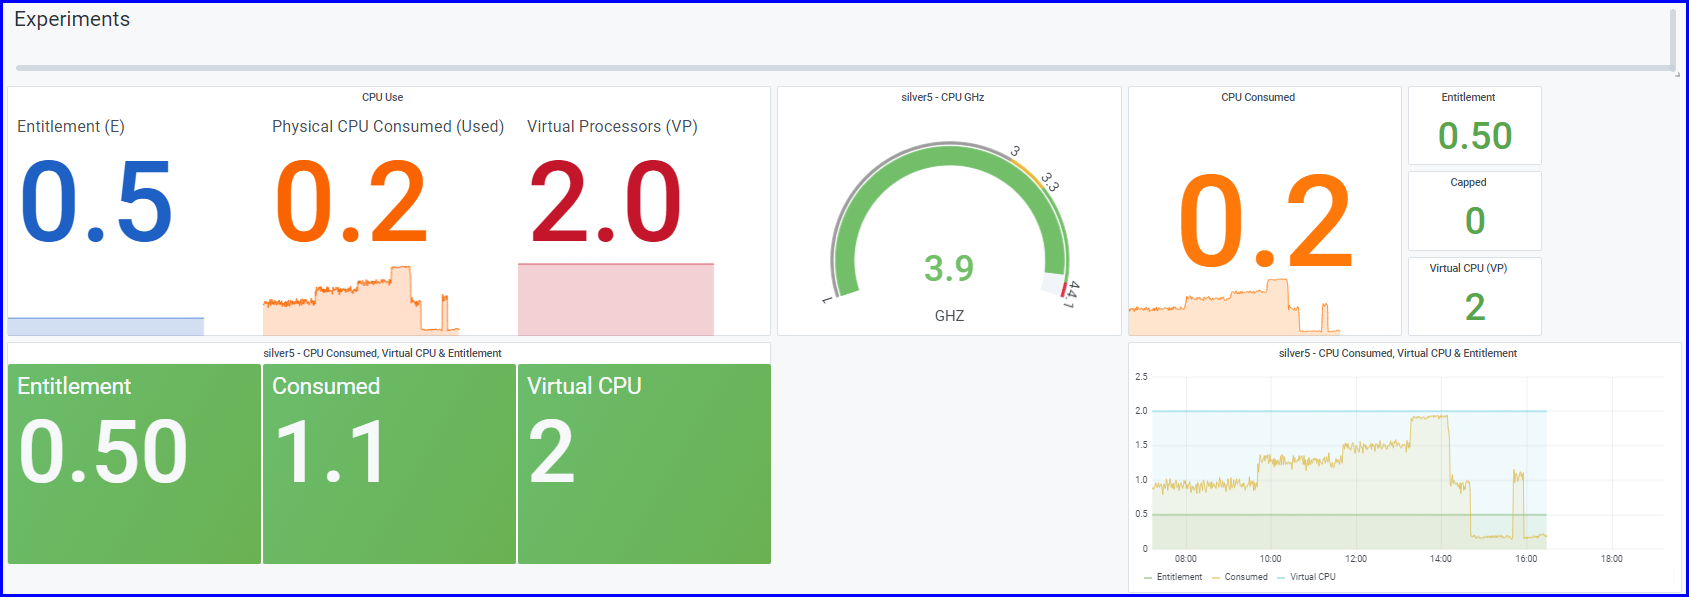
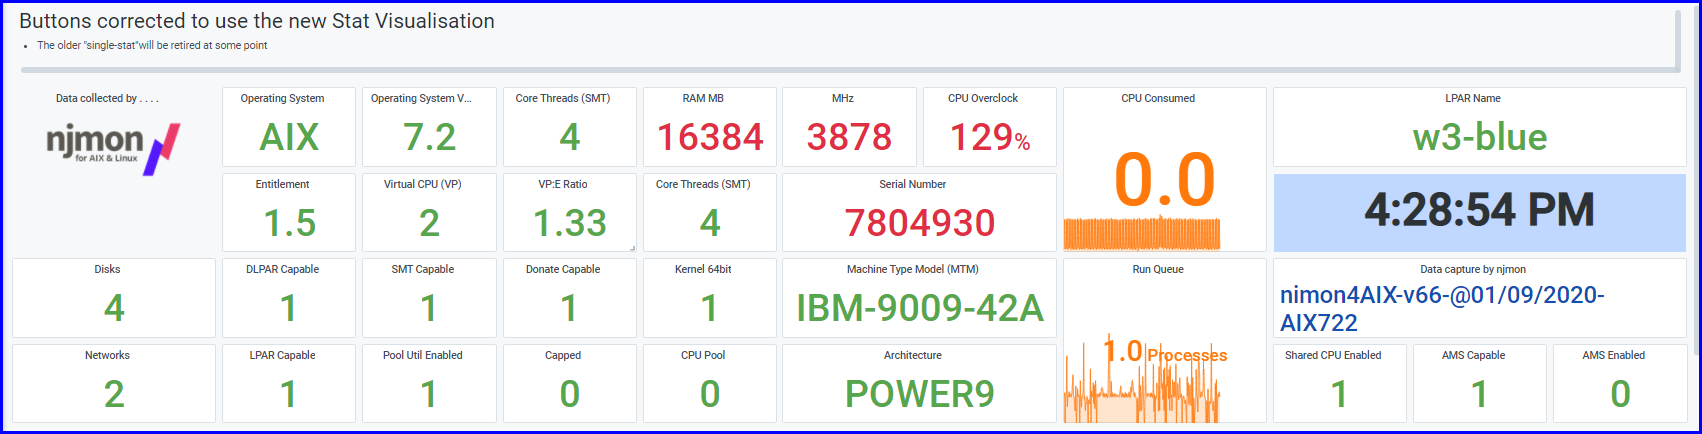
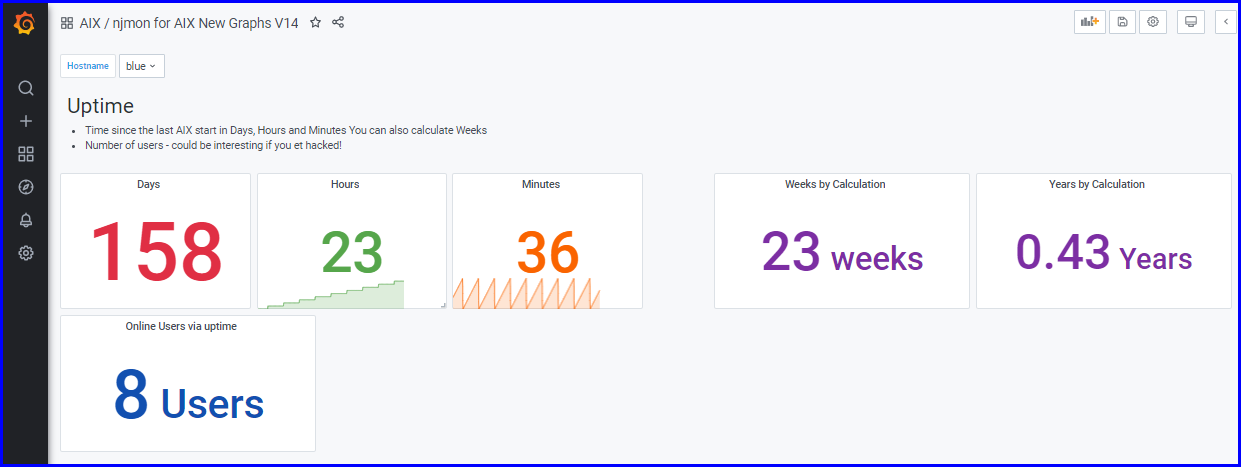
New Server uptime panels and User count New Power info panels using the new Stat visualisation (Single-Stat to be retired) New Experiments in E, VP and USE consumed plus GHz Rev-Counter Gauge New "work in progress" for AIX Active Memory Expansion New compare Logical CPU in individual Stat buttons and classic line graphs
Data source config
Collector type:
Collector plugins:
Collector config:
Revisions
Upload an updated version of an exported dashboard.json file from Grafana
| Revision | Description | Created | |
|---|---|---|---|
| Download |