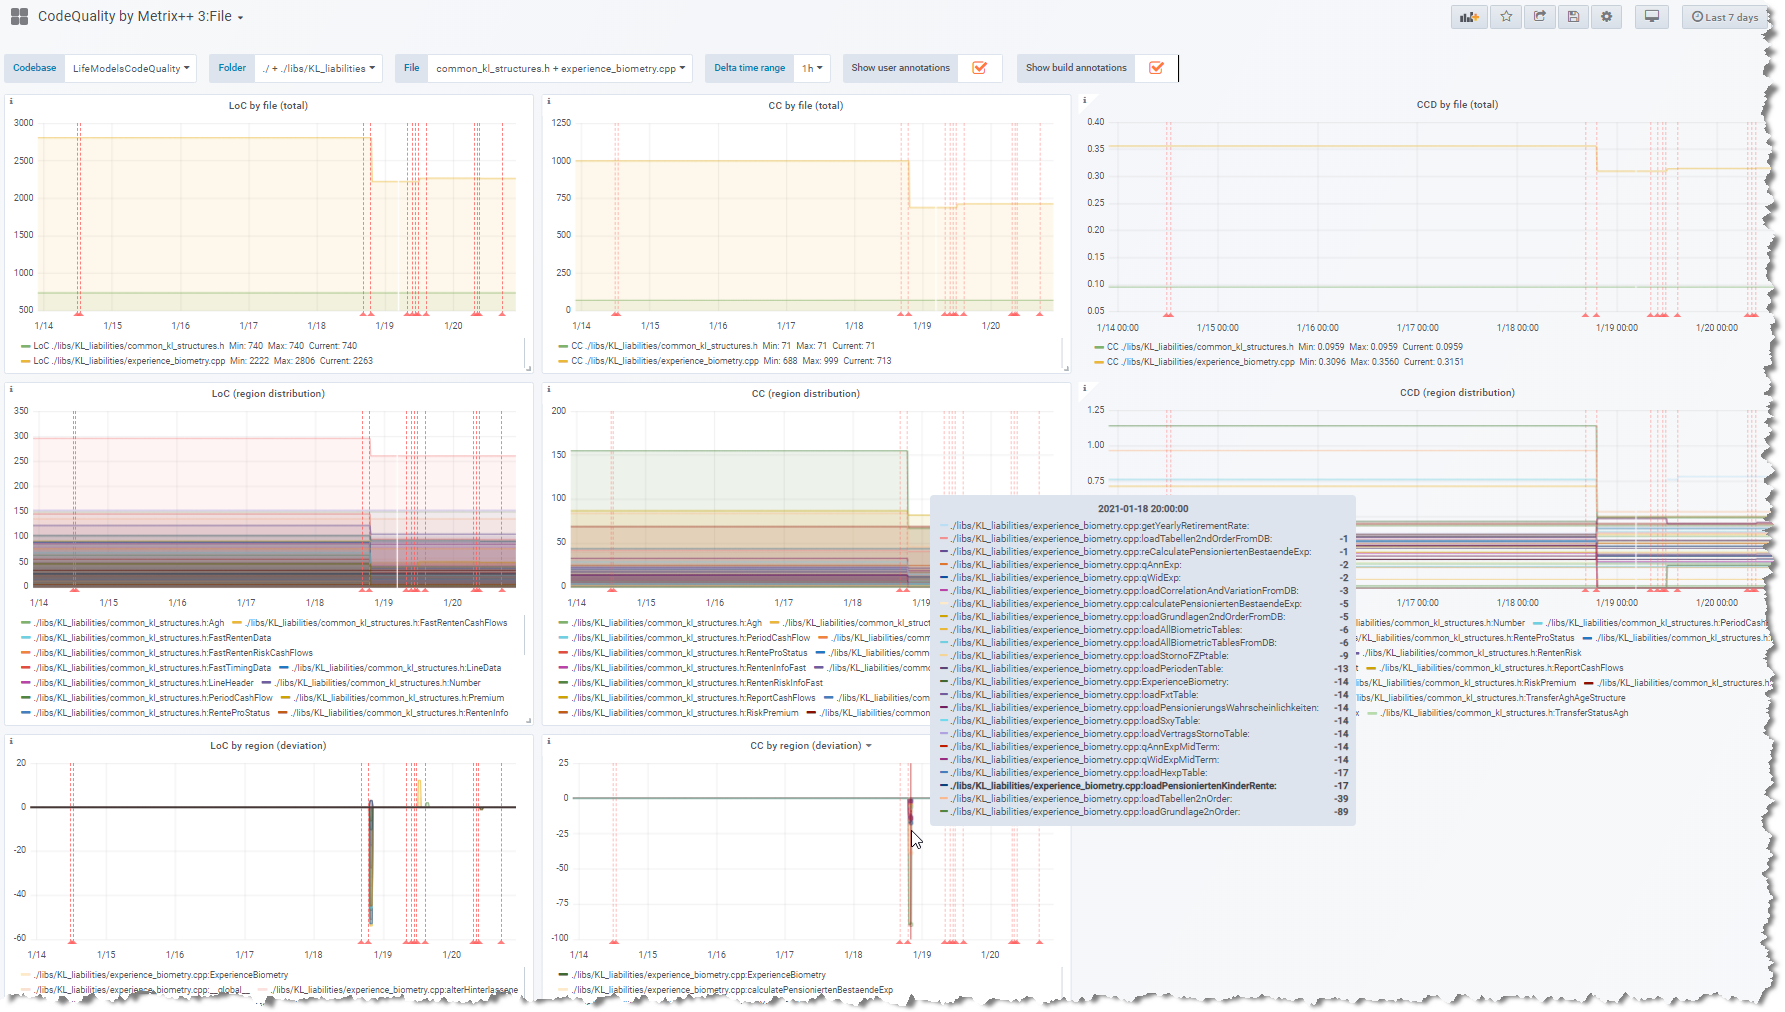
CodeQuality by Metrix++ 3:File
Visualize code quality metrics LoC (Lines of Code), CC (Cyclomatic Complexity) and resulting CCD (Cyclomatic Complexity Density) collected for your codebase by Metrix++ in Prometheus
This dashboard allows you to visualize code quality metrics
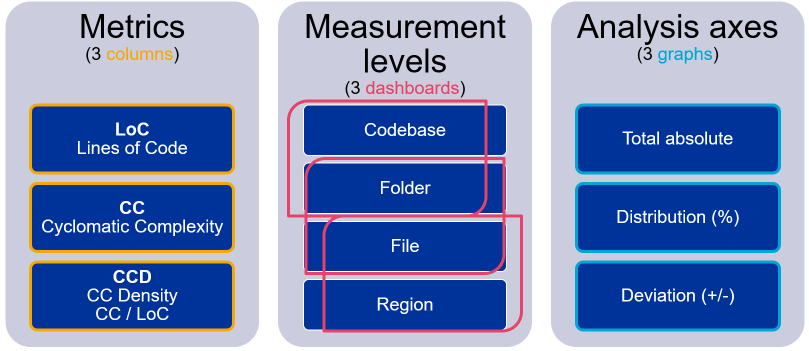
- LoC (Lines of Code)
- CC (Cyclomatic Complexity)
- and the resulting CCD (Cyclomatic Complexity Density), as division of CD by LoC
(all 3 horizontally in successive columns) collected for your codebase files (C/C++, C# and Java) by Metrix++ in Prometheus. For each metric, 3 graphs are rendered vertically showing successively:
- total absolute for the current selection (codebase files)
- distribution of the total 1. over the next level items (regions, i.e. methods, structures...)
- deviation over the time of the total 1. by next level items (regions)
It is part of a set of 3 dashboards, linked for the sake of drilldown analysis:
CodeQuality by Metrix++ 3:File is designed as last dashboard used during analysis, showing metrics at codebase file level (selection) up to (scolling down to) the next level information about regions (i.e. methods, structures...).
First it requires you to put Metrix++ in place for your codebase (C/C++, C# and Java), (see also its github repo), and to setup a Prometheus instance scraping the output of the following commands:
python metrix++.py view --ll=ERROR --format=prometheuspython metrix++.py view --ll=ERROR --format=prometheus -- /home/mycodebasepython metrix++.py view --ll=ERROR --format=prometheus -- /home/mycodebase/srcpython metrix++.py view --ll=ERROR --format=prometheus -- /home/mycodebase/src/mainpython metrix++.py view --ll=ERROR --format=prometheus -- /home/mycodebase/src/main/javapython metrix++.py view --ll=ERROR --format=prometheus -- /home/mycodebase/src/main/java/Foo.java
Data source config
Collector config:
Upload an updated version of an exported dashboard.json file from Grafana
| Revision | Description | Created | |
|---|---|---|---|
| Download |


