
Linux host
("server single")
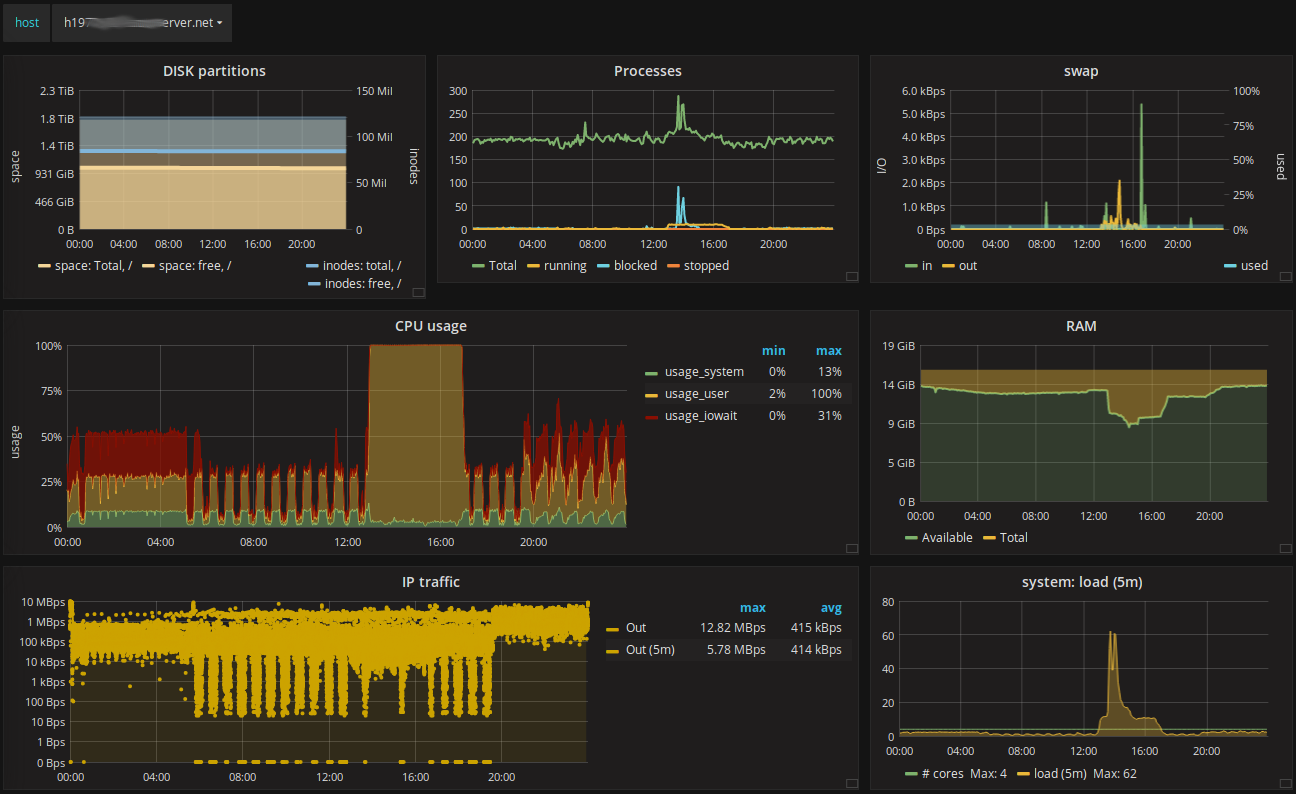
This dashboard shows basic common metrics of any *nix machine. I tried to make a clear view and pick relevant measurements only from telegraf’s native plugins. No extra work required.
Implements templated “host” variable, so you can select a host from a list.
Graph panel’s features allow to figure out trends. To compare, switch between hosts quickly.
The dashboard fits into a single window without scrolling.
It provides the following metrics:
- disk space
- process count
- swap
- cpu usage
- RAM usage
- IP outgoing traffic
- system load
Data source config
Collector type:
Collector plugins:
Collector config:
Dashboard revisions
Upload an updated version of an exported dashboard.json file from Grafana
| Revision | Decscription | Created | |
|---|---|---|---|
| Download |
Sign up for Grafana Cloud

Get up and running in minutes with the Grafana Cloud free tier, which includes free forever 10k metrics, 50GB logs, 50GB traces, 500 VUh, and more.
Get this dashboard
Data source:
Dependencies: