Linux host
("server single")
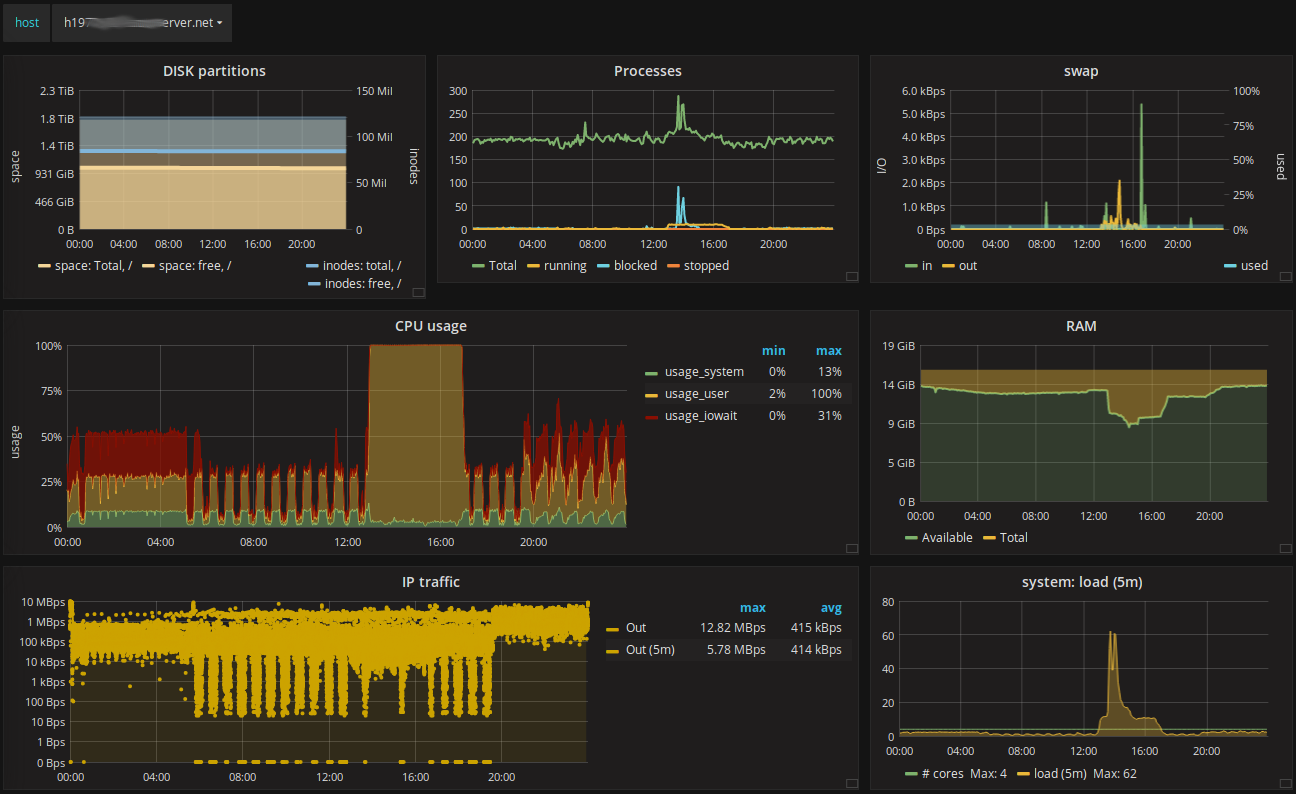
This dashboard shows basic common metrics of any *nix machine. I tried to make a clear view and pick relevant measurements only from telegraf's native plugins. No extra work required.
Implements templated "host" variable, so you can select a host from a list.
Graph panel's features allow to figure out trends. To compare, switch between hosts quickly.
The dashboard fits into a single window without scrolling.
It provides the following metrics:
- disk space
- process count
- swap
- cpu usage
- RAM usage
- IP outgoing traffic
- system load
Data source config
Collector type:
Collector plugins:
Collector config:
Revisions
Upload an updated version of an exported dashboard.json file from Grafana
| Revision | Description | Created | |
|---|---|---|---|
| Download |
Linux Server
Monitor Linux with Grafana. Easily monitor your Linux deployment with Grafana Cloud's out-of-the-box monitoring solution.
Learn more