
Netdata: Disks Stats
Per disk metrics overview (+mdadm)
About dashboard
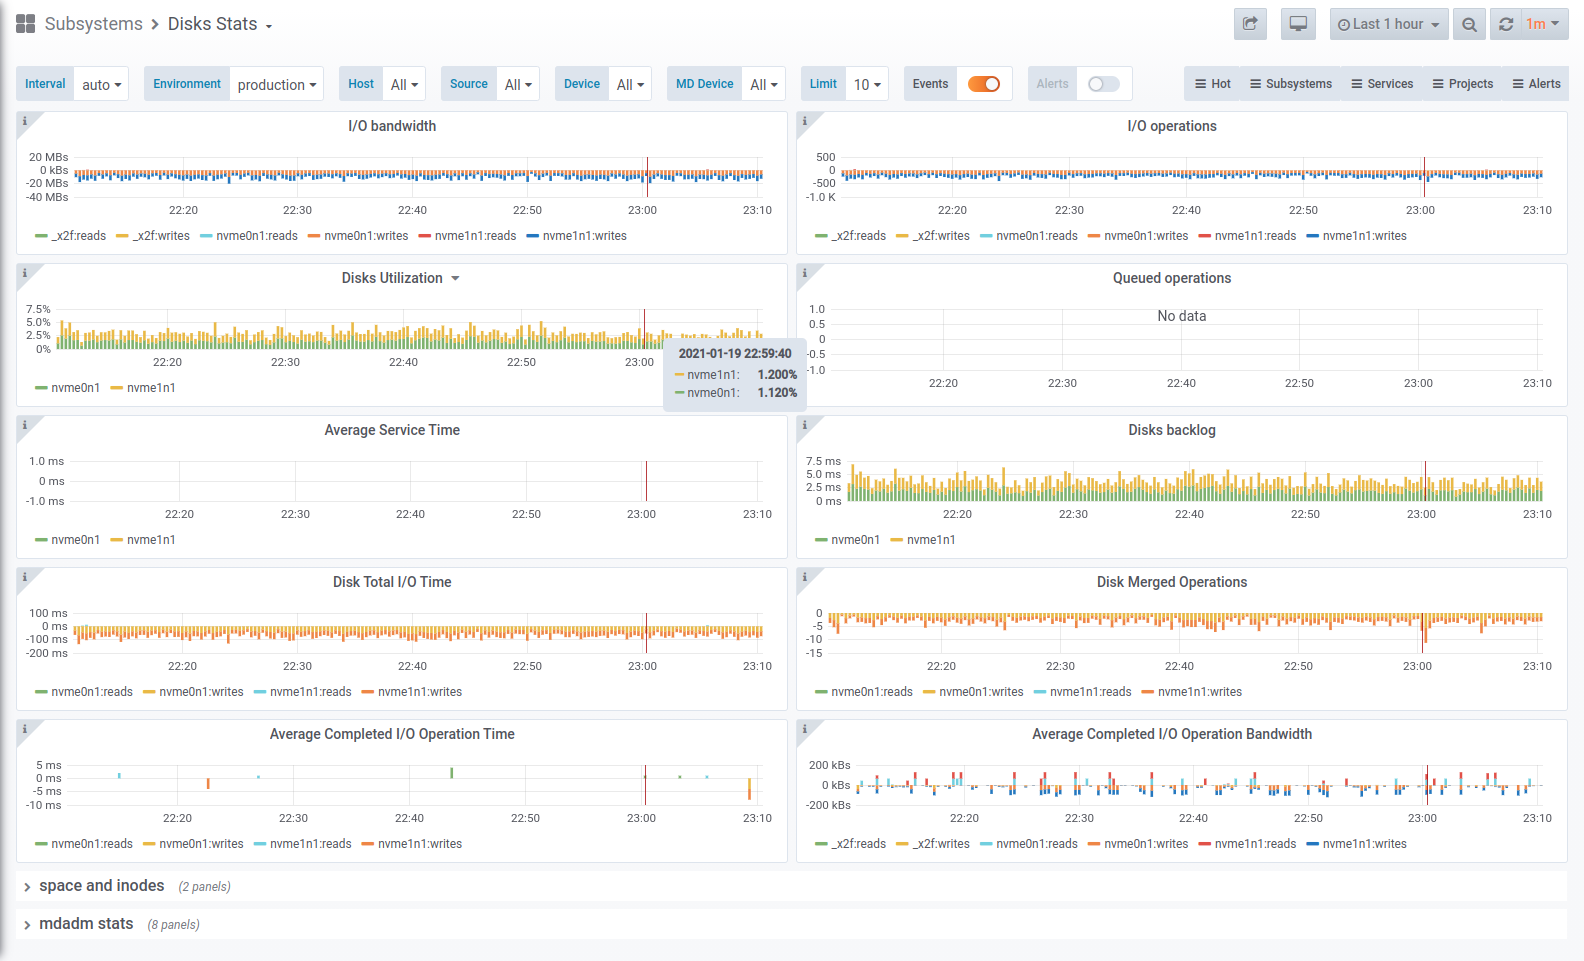
A simple dashboard with an overview for disk related metrics:
- I/O operations and bandwidth
- Disk utilization and backlog
- Queued operations and avergage service time
- Used space and inodes
Plus mdadm related metrics (i.e. software raid):
- current status and amount of faulty devices
- duration and bandwidth of background operations
- devices in check/resync/reshape/recovery statuses
More dashboards for Netdata you can find here.
How to use
Netdata setup
Follow these instructions to setup disks monitoring in Netdata.
Prometheus setup
Please note that you need Netdata as an exporter for metrics. Plus, these labels are mandatory:
- job
- env
- instance
- group
- source
In your prometheus.yml it should look like this:
- job_name: netdata
  metrics_path: /api/v1/allmetrics?format=prometheus_all_hosts&source=raw
  relabel_configs:
  - source_labels: [__address__]
    regex: ^(.+)\.\w+:\d+
    target_label: instance
    action: replace
  static_configs:
  - targets: [netdata.hostname.here:19999]
    labels:
      env: production
      group: applications
source: newprojectWARNING: Without these labels, this dashboard won’t be fully functioning.
Links
License
GPL3
Author
OSSHelp Team, see https://oss.help
Data source config
Collector type:
Collector plugins:
Collector config:
Dashboard revisions
Upload an updated version of an exported dashboard.json file from Grafana
| Revision | Decscription | Created | |
|---|---|---|---|
| Download |
Sign up for Grafana Cloud

Get up and running in minutes with the Grafana Cloud free tier, which includes free forever 10k metrics, 50GB logs, 50GB traces, 500 VUh, and more.
Get this dashboard
Data source:
Dependencies: