tado° (Celsius)
Grafana Dashboard for Prometheus eko/tado-exporter that shows the temperature setting, current temperature, humidity and activity for all rooms. A detailed view is shown based on the selected room.
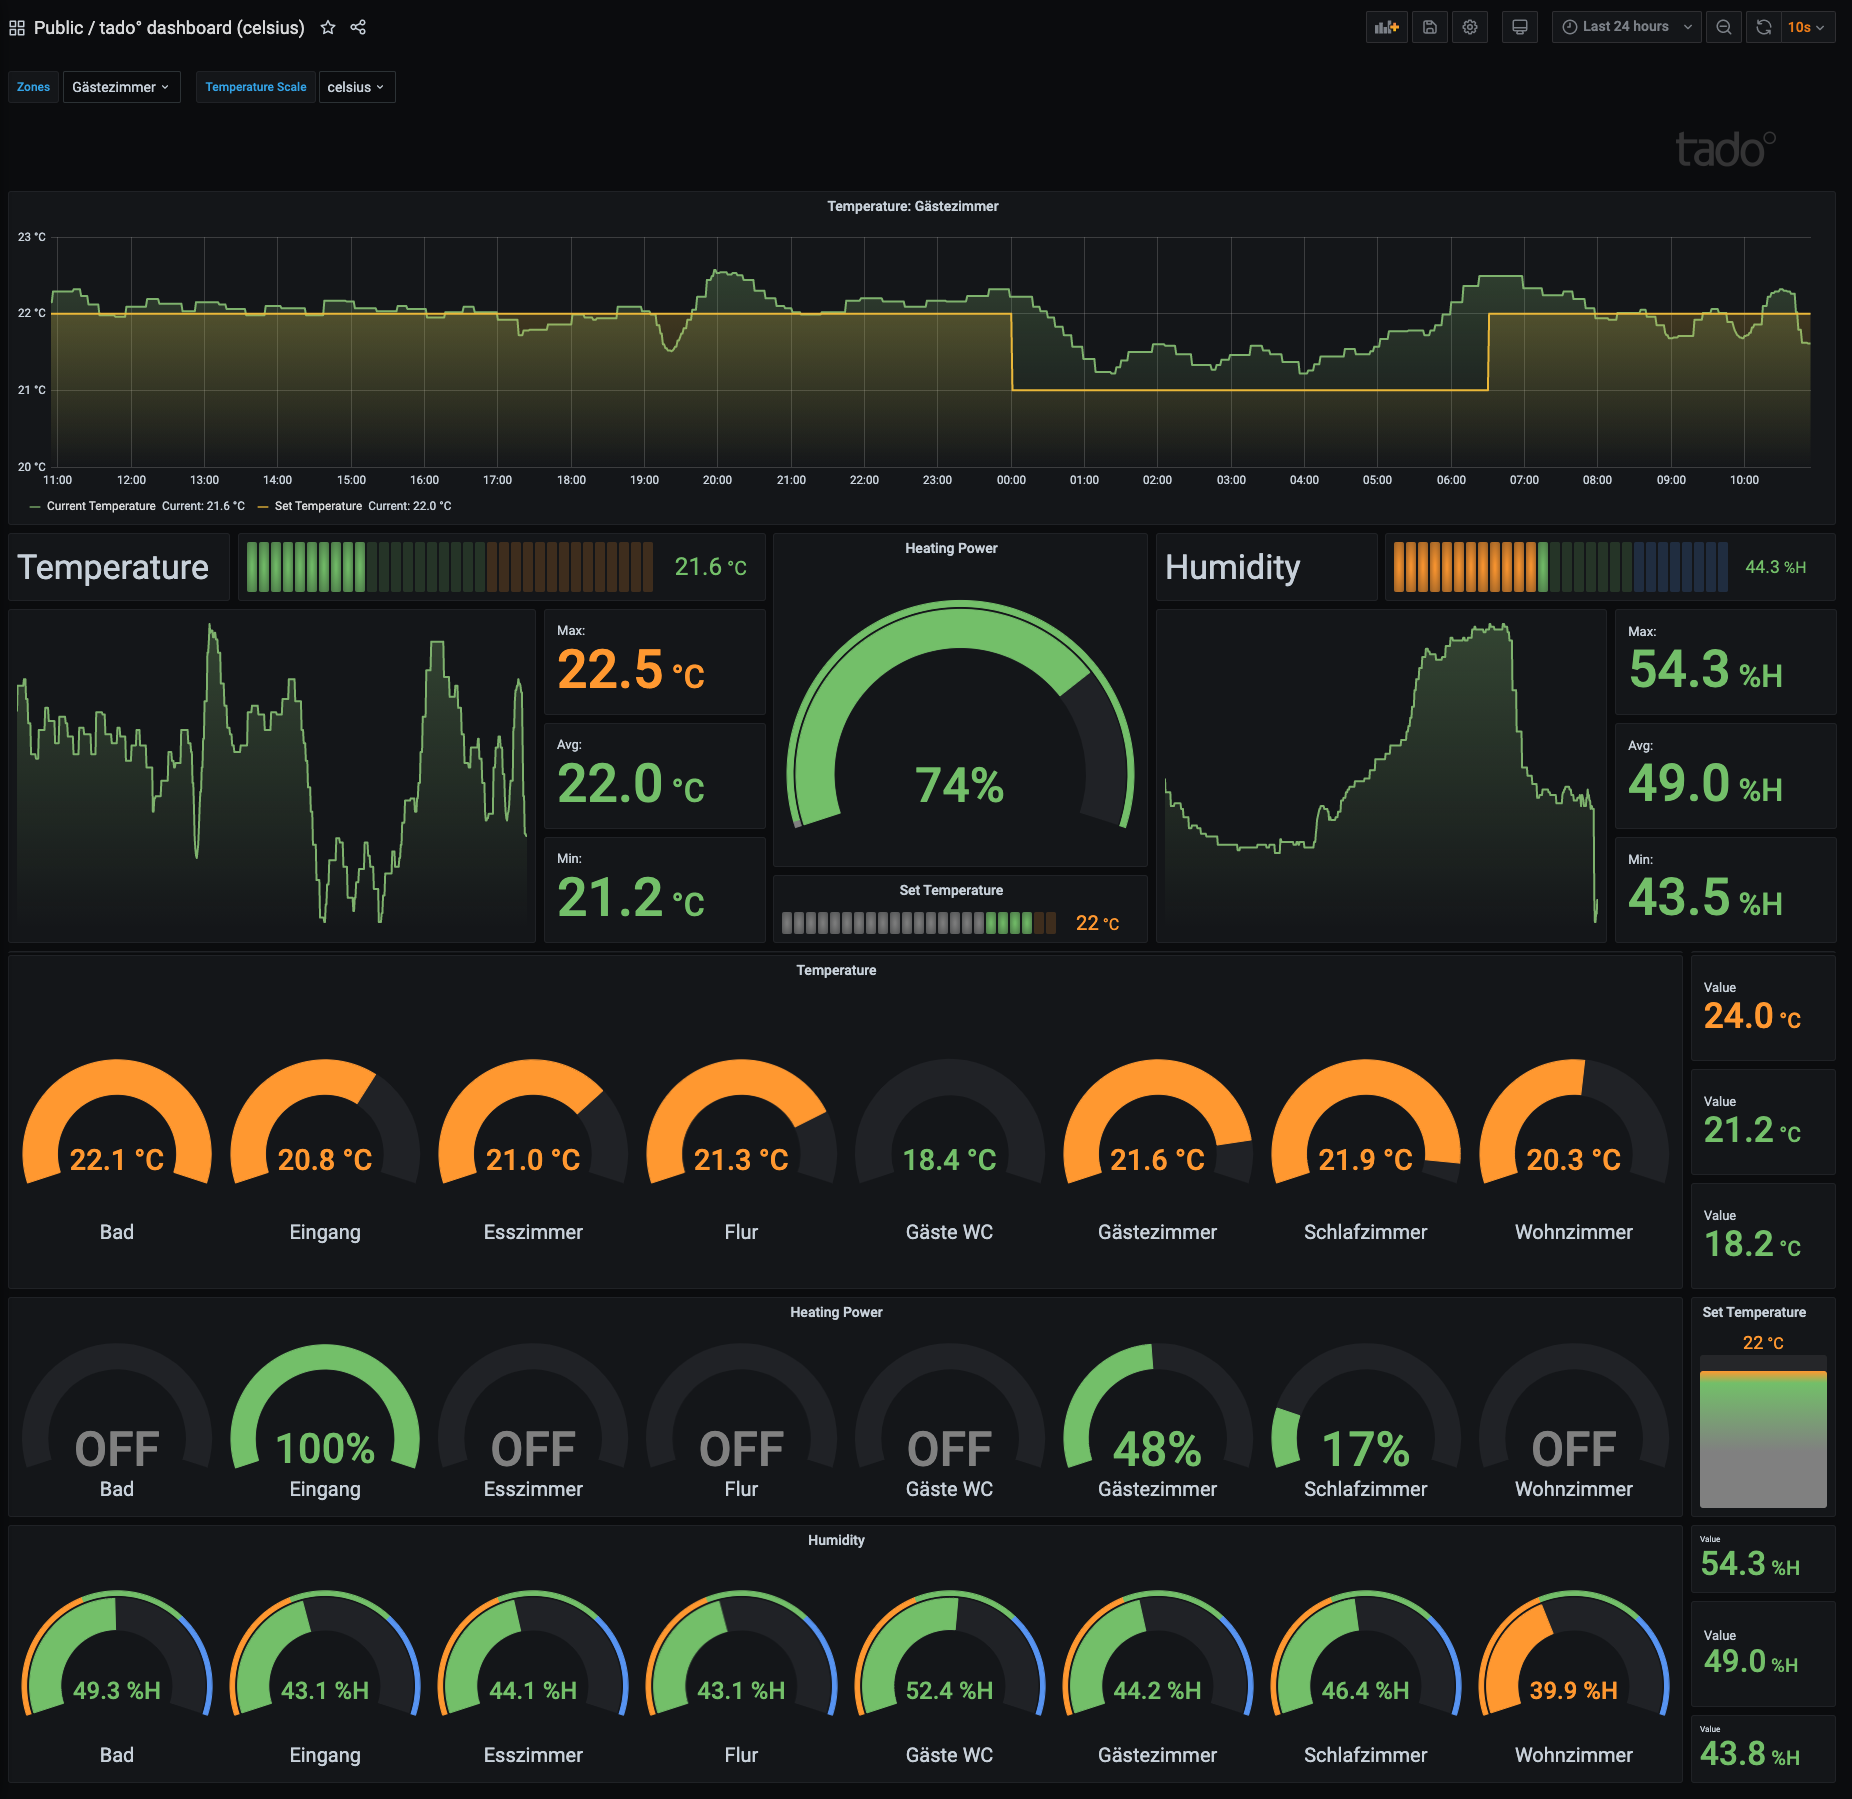
Grafana Dashboard for Prometheus eko/tado-exporter that shows the temperature setting, current temperature, humidity and activity for all rooms equipped with tado° Smart Radiator Thermostat and/or Temperature Sensor.
This dashboard shows all values (unit symbol and thresholds) in Celsius. If you prefer to see your results in Fahrenheit please use this dashboard:
https://grafana.com/grafana/dashboards/13700
For detailed informations, please visit:
disisto/grafana-dashboard-for-prometheus-tado-exporter

This project is not affiliated with tado°. All mentioned trademarks are the property of their respective owners.
Data source config
Collector config:
Upload an updated version of an exported dashboard.json file from Grafana
| Revision | Description | Created | |
|---|---|---|---|
| Download |