dnsdist dashboard
Prometheus Powerdns exporter metrics.
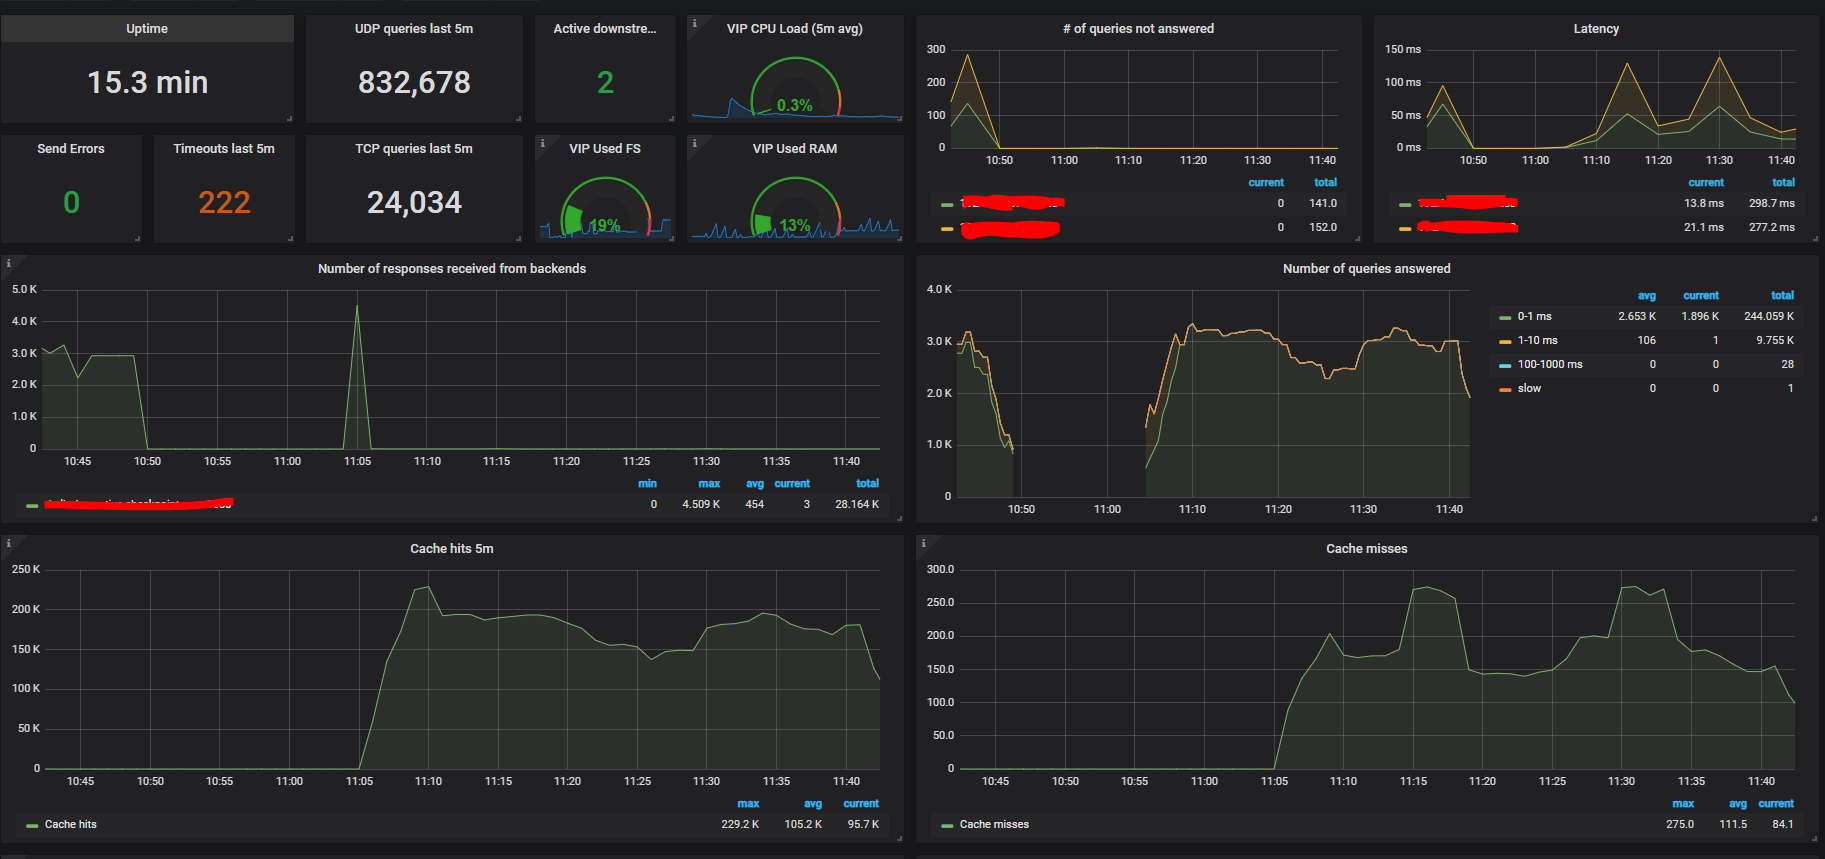
Built using native Prometheus exporter built-into the dnsdist code.
All you need to do is to enable the built-in web server (https://dnsdist.org/guides/webserver.html) Setup your Prometheus to scrape the endpoint, import the dashboard. set your Prometheus data source and you're good to go
Rev 3. now includes caching visibility
Data source config
Collector type:
Collector plugins:
Collector config:
Revisions
Upload an updated version of an exported dashboard.json file from Grafana
| Revision | Description | Created | |
|---|---|---|---|
| Download |