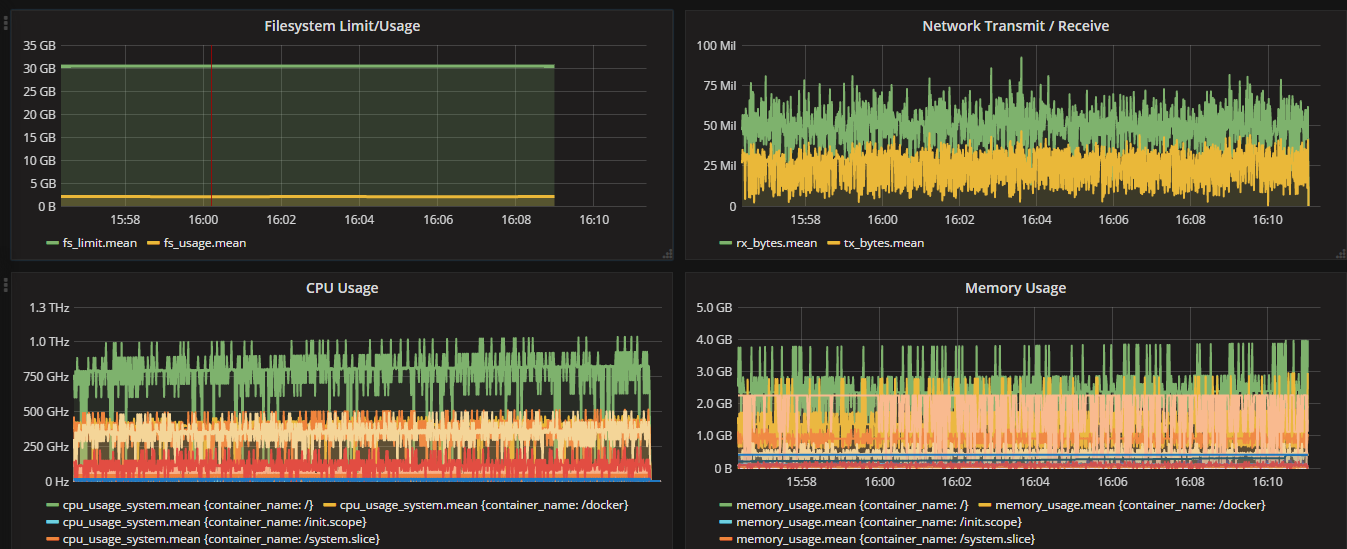
Docker Swarm Dashboard
Docker Swarm Cluster Dashboard
docker network create --driver overlay monitoring
echo "Creating the [influxdb] service"
docker service create
--network monitoring
--publish=8083:8083
--publish=8086:8086
--mount=type=bind,source=/opt/influxdb/data,target=/var/lib/influxdb
--name=influxdb
--constraint=node.role==manager
influxdb:alpine
echo "Creating the [cadvisor] service"
docker service create
--network monitoring
--name cadvisor
--mode global
--mount type=bind,source=/var/run,target=/var/run,readonly=false
--mount type=bind,source=/,target=/rootfs,readonly=true
--mount type=bind,source=/sys,target=/sys,readonly=true
--mount type=bind,source=/var/lib/docker,target=/var/lib/docker,readonly=true
google/cadvisor -storage_driver=influxdb -storage_driver_host=influxdb:8086
-storage_driver_db=cadvisor
echo "Creating the [grafana] service"
docker service create
--network monitoring
--publish=3000:3000
-e "GF_SECURITY_ADMIN_PASSWORD=admin"
--constraint=node.role==manager
--name grafana grafana/grafana
Data source config
Collector config:
Upload an updated version of an exported dashboard.json file from Grafana
| Revision | Description | Created | |
|---|---|---|---|
| Download |
Docker
Easily monitor Docker with Grafana Cloud's out-of-the-box monitoring solution.
Learn more