S.M.A.R.T Dashboard
Dashboard for viewing detailed disk information based on S.M.A.R.T data
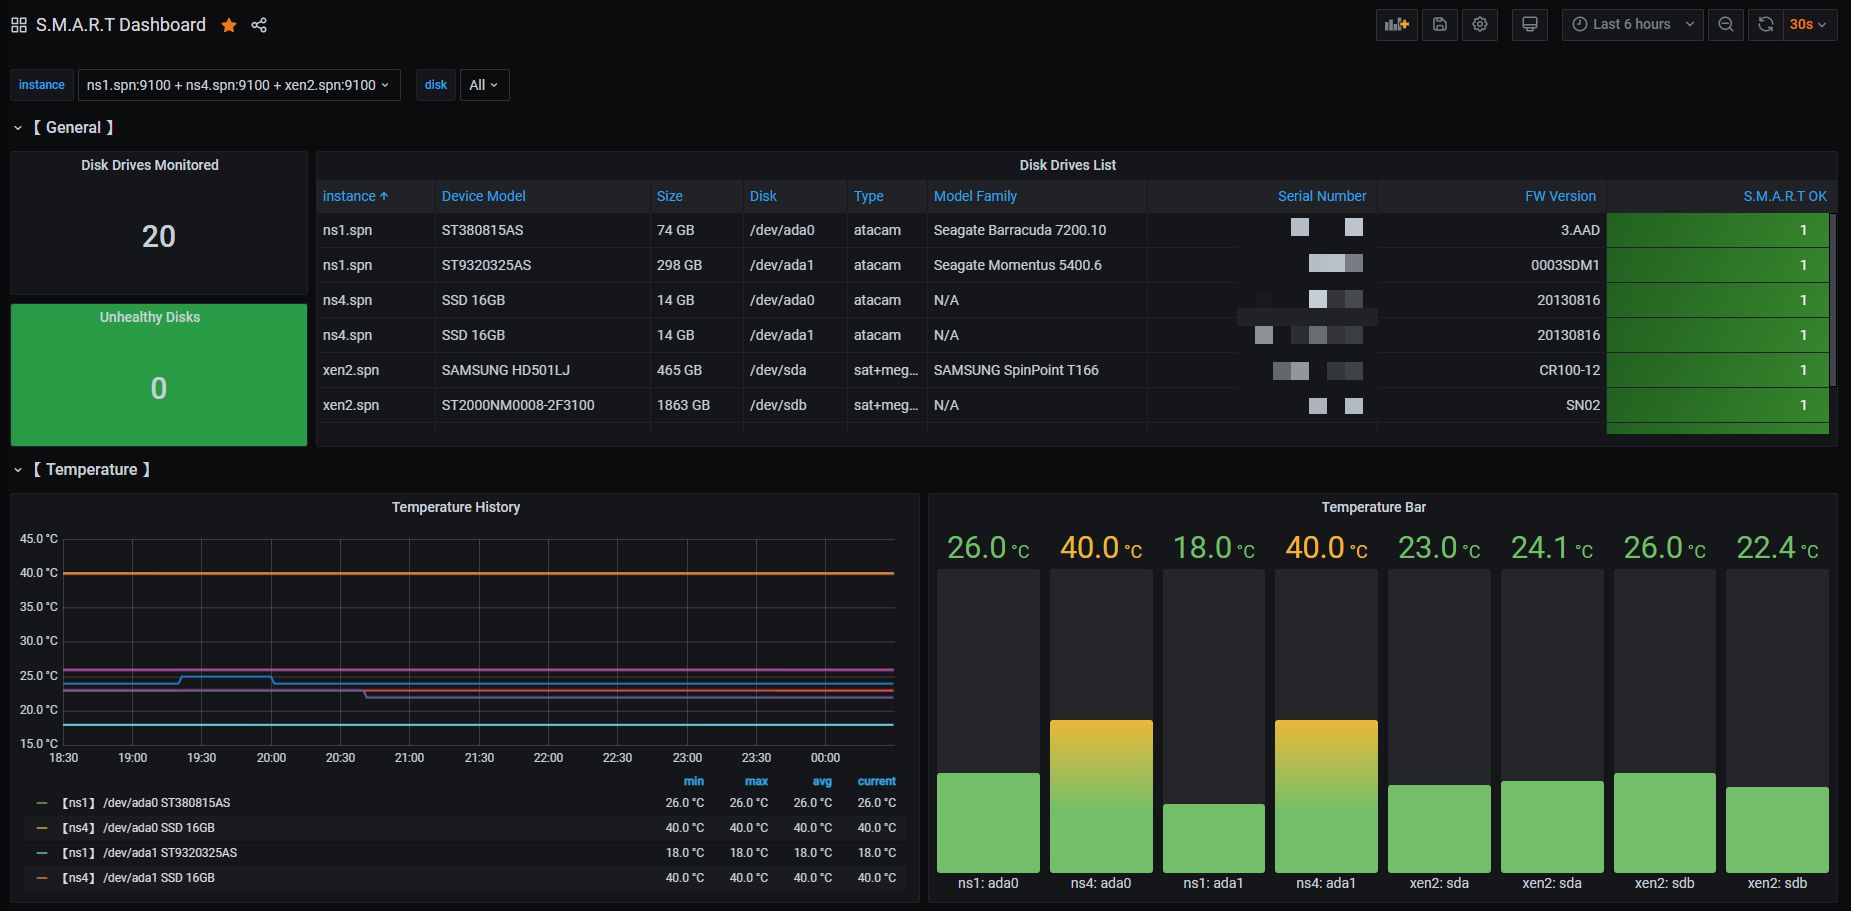
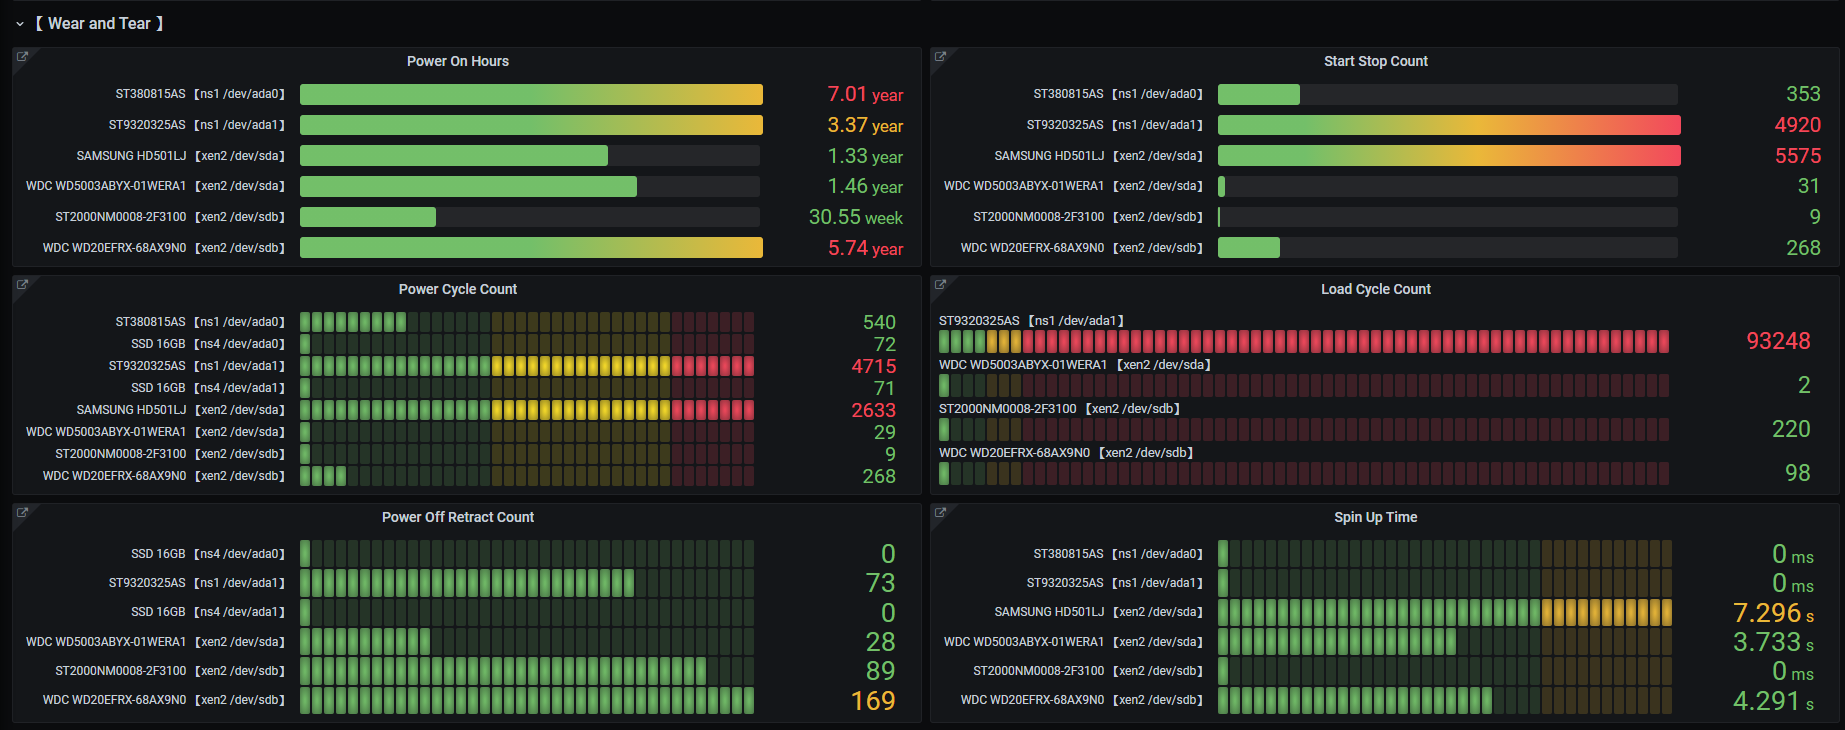
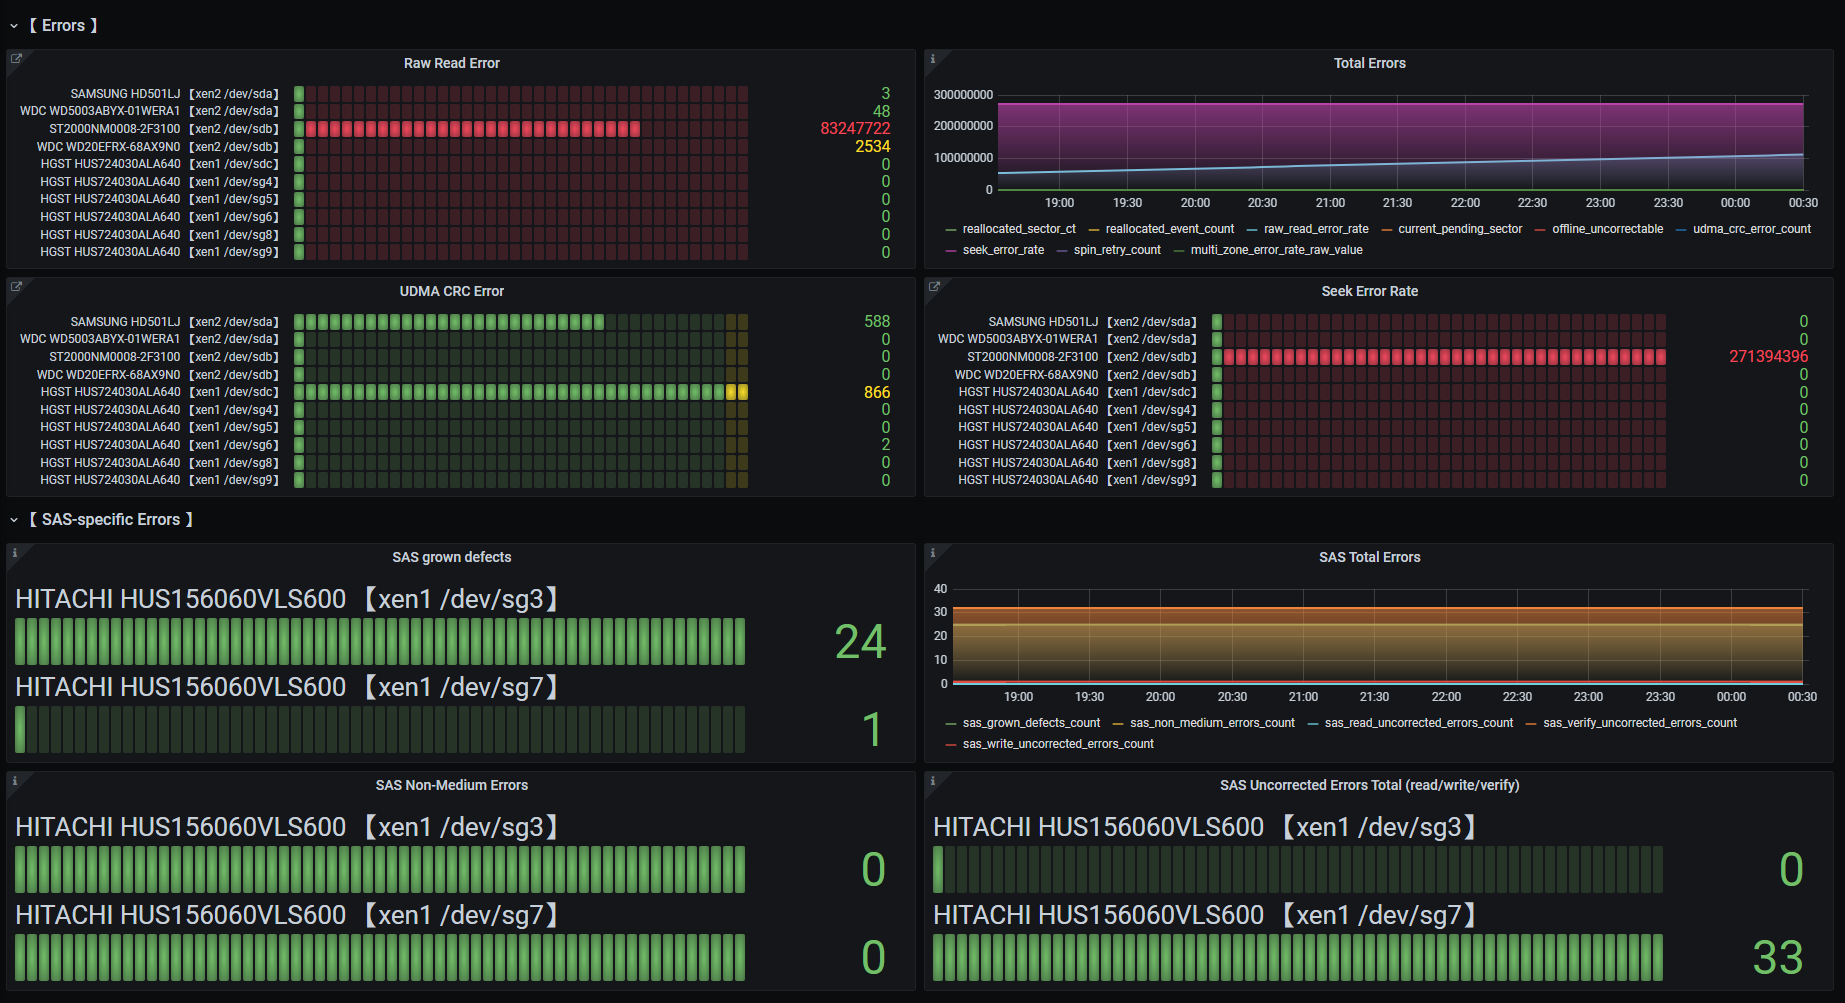
Nice and detailed dashboard for viewing ordered disk information taken from the S.M.A.R.T data. Most of the panels have info links to the corresponding S.M.A.R.T attribute description. Contains:
- General panel with detailed disk data: model, name, size, firmware, serial, etc
- Temperature panel with graphs and gauge bars
- Wear panel showing disk lifetime cycles counters
- Errors panel with bars and graphs based on the various disk errors observed in S.M.A.R.T
- SAS-specific error panel
Please follow the instructions here on how to collect metrics for this dashboard.
Data source config
Collector type:
Collector plugins:
Collector config:
Revisions
Upload an updated version of an exported dashboard.json file from Grafana
| Revision | Description | Created | |
|---|---|---|---|
| Download |


