ClickHouse Performance Monitor
ClickHouse Performance Monitor
ClickHouse Version
The Dashboard is available for ClickHouse v20.8.7.Other versions are not guaranteed to fit.
Features
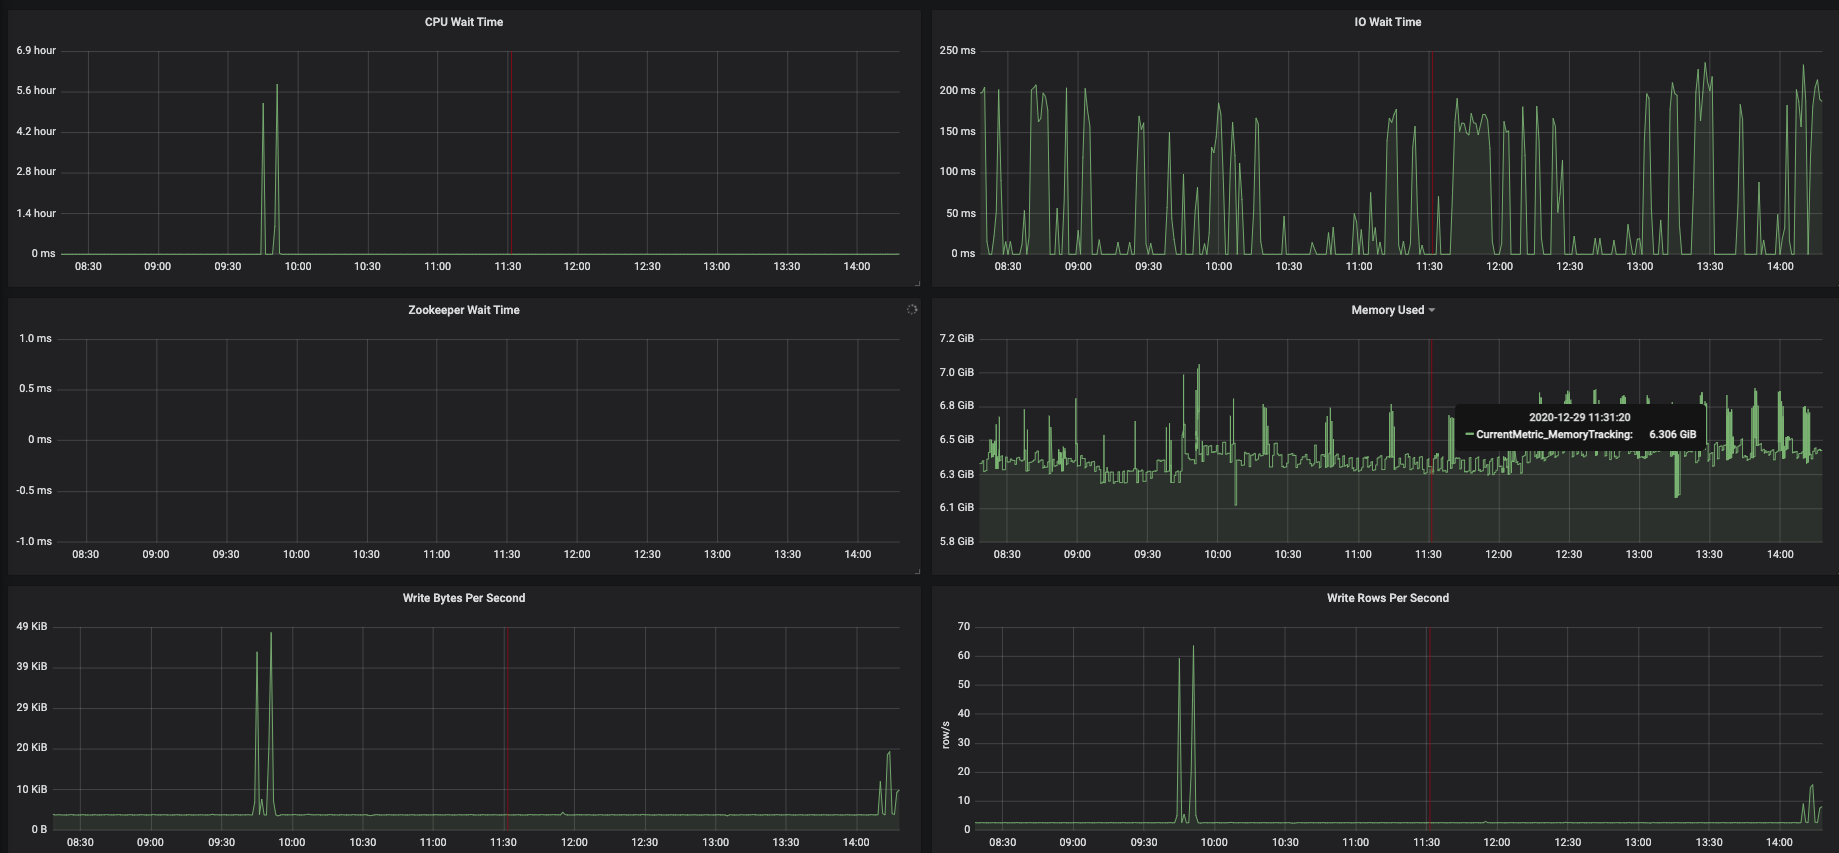
- Memory Used Info (Since v1.0)
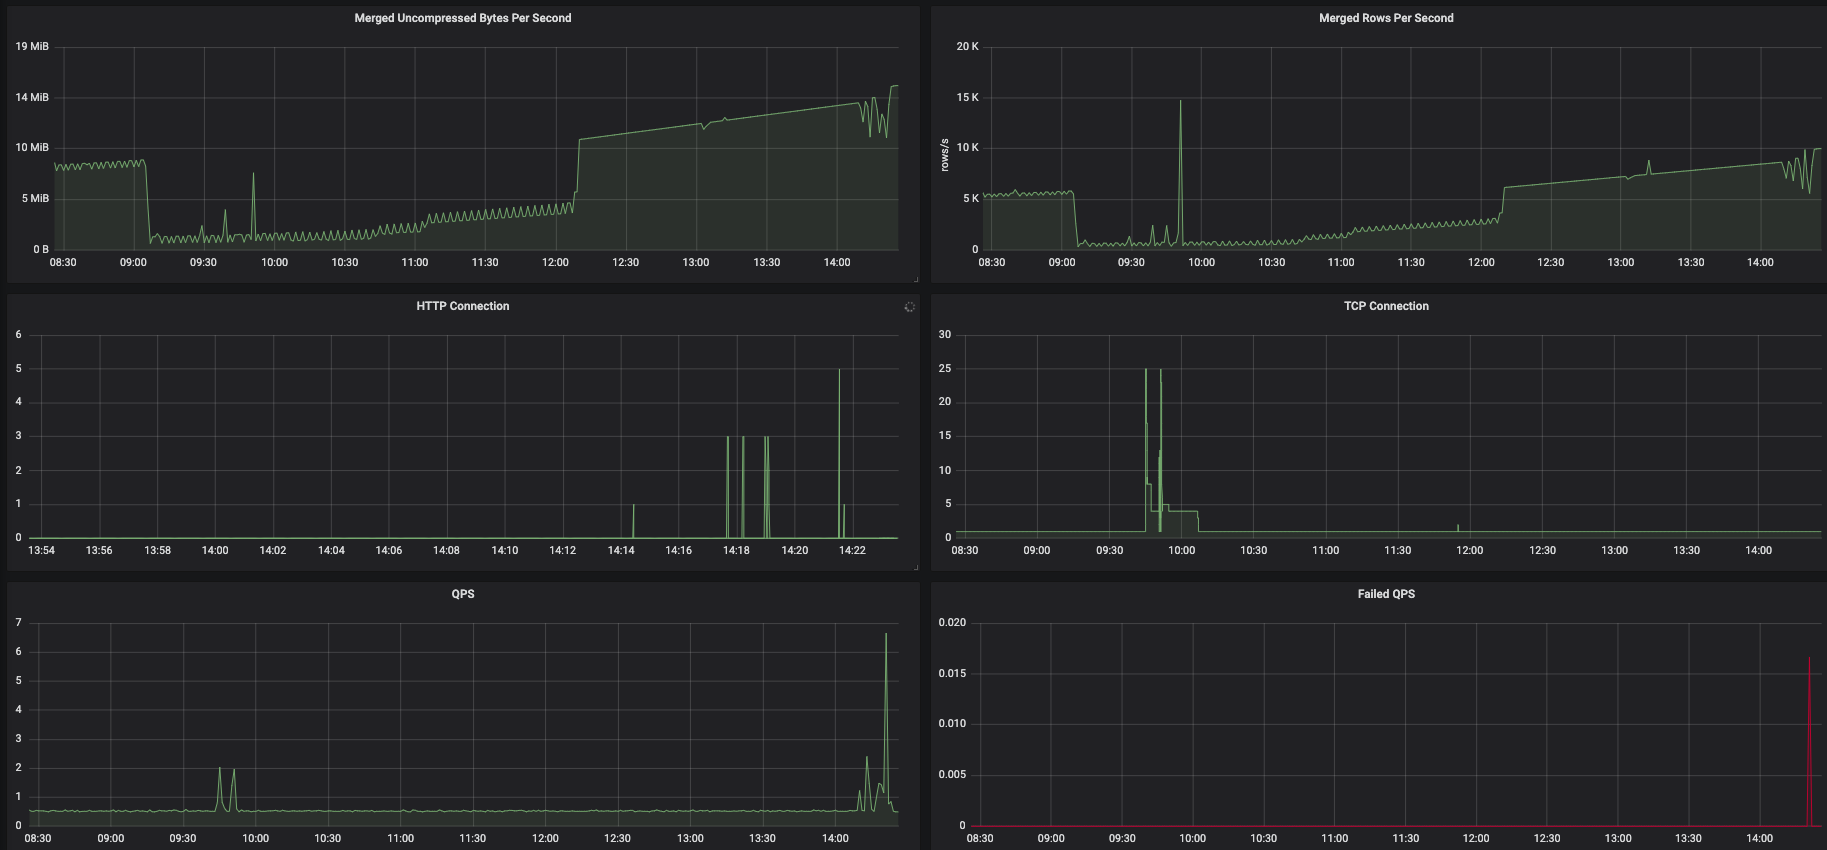
- QPS and Fail QPS (Since v1.0)
- Write Rows Per Second and Write Bytes Per Second (Since v1.0)
- Merged Row Per Second and Merged Uncompressed Bytes Per Second (Since v1.0)
- HTTP Connection and TCP Connection (Since v1.0)
- CPU Wait Time and IO Wait Time and Zookeeper Wait Time (Since v1.0)
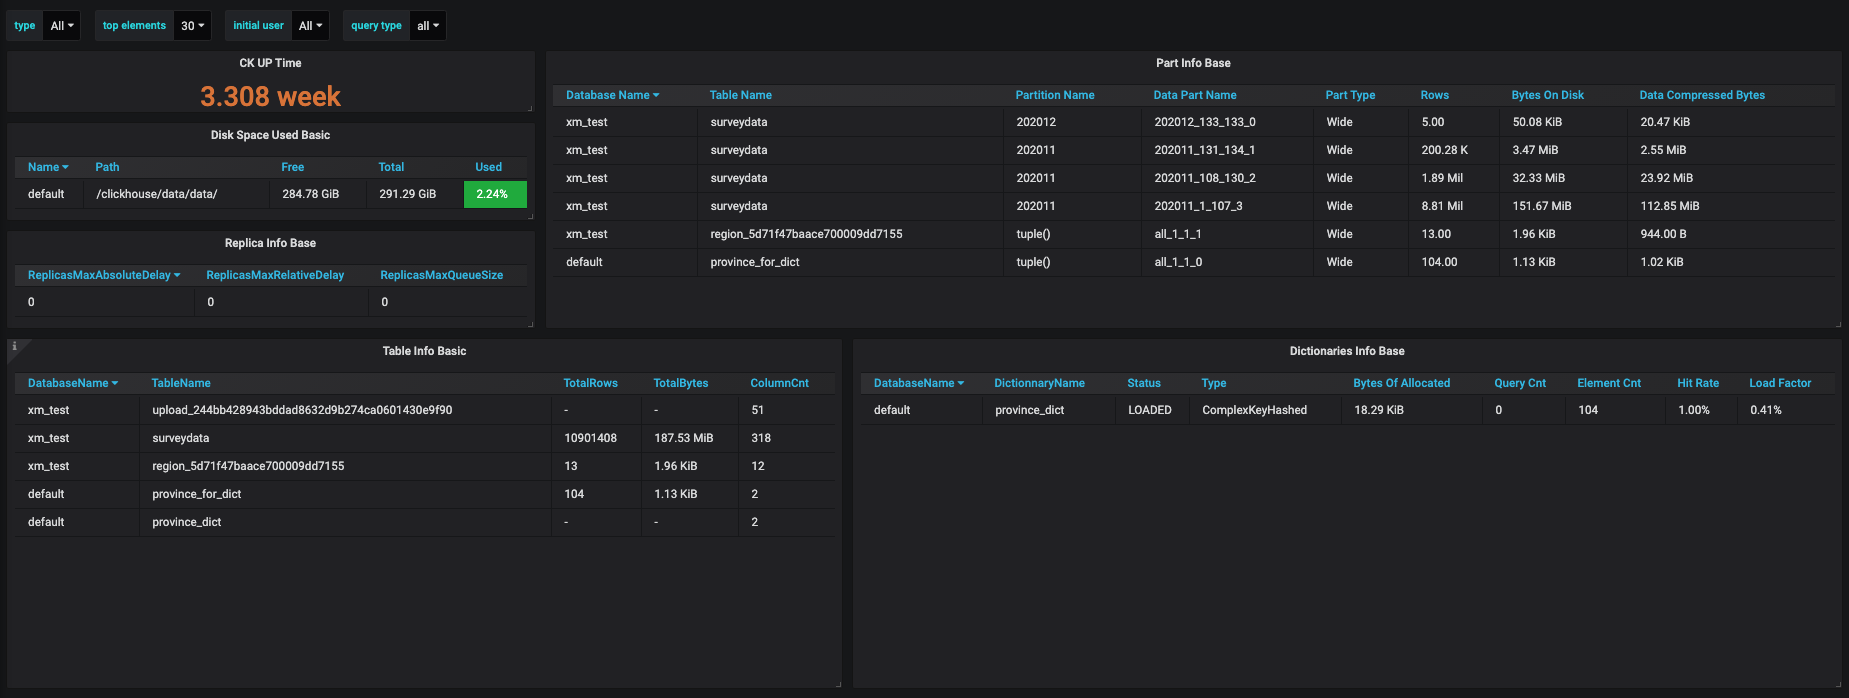
- Disk Space Used (Since v1.0)
- Dictionaries Info (Since v1.0)
- Table Info (Since v1.0)
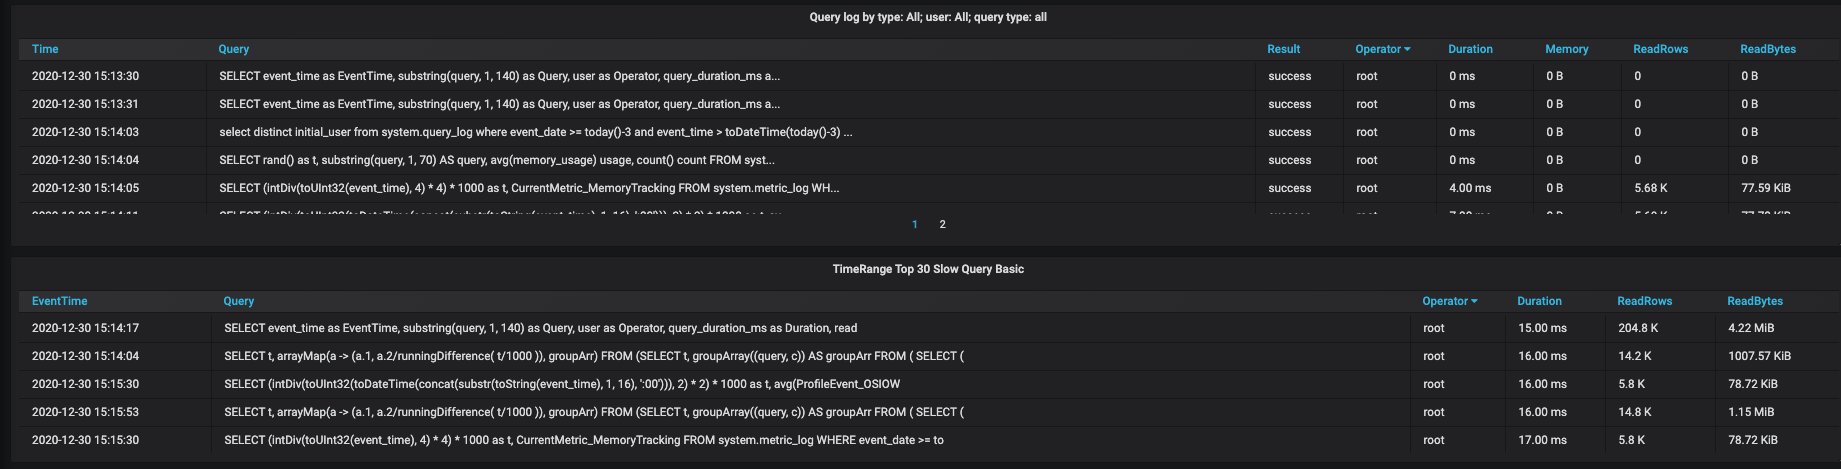
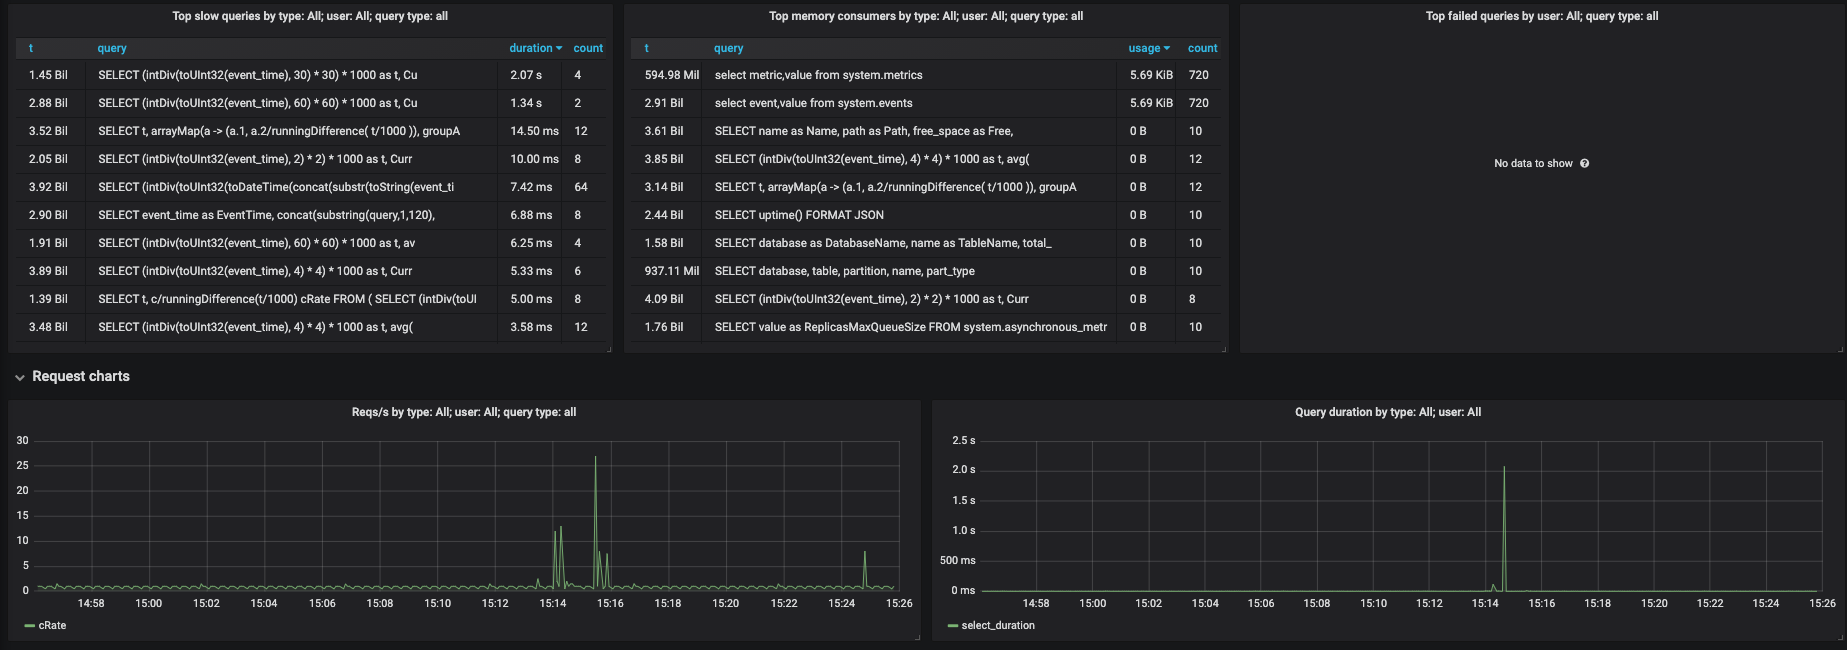
- Query Log Info (Since v3.0)
- Replica Info (Since v3.0)
- Part Info (Since v3.0)
Dashboard Version Desc
- v1.0 metrics monitoring granularity is second.
- v2.0 metrics monitoring granularity is minuter,the acquisition is in seconds and the display is averaged in minutes.
- v3.0 is an extension to dashboard 2515 and v2.0.More information was added to the query information to help analyze the slow log problem.
- v4.0 fix some bugs about unit.
If you don't care about query information and only care about CK performance status, v2.0 is recommended.
Data source config
Collector type:
Collector plugins:
Collector config:
Revisions
Upload an updated version of an exported dashboard.json file from Grafana
| Revision | Description | Created | |
|---|---|---|---|
| Download |
ClickHouse
Monitor ClickHouse with Grafana. Easily keep tabs on your instance or cluster with Grafana Cloud's out-of-the-box monitoring solution.
Learn more