
MongoDB Atlas Overview
This dashboard allows you to fetch process, database, and disk logs from MongoDB Atlas API
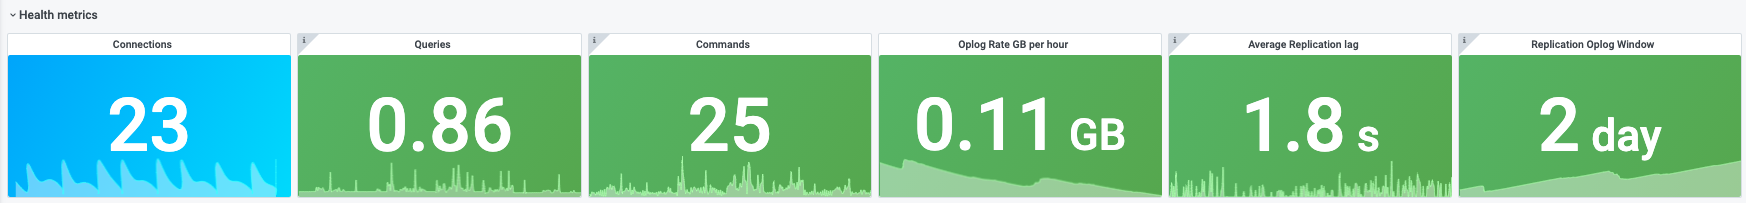
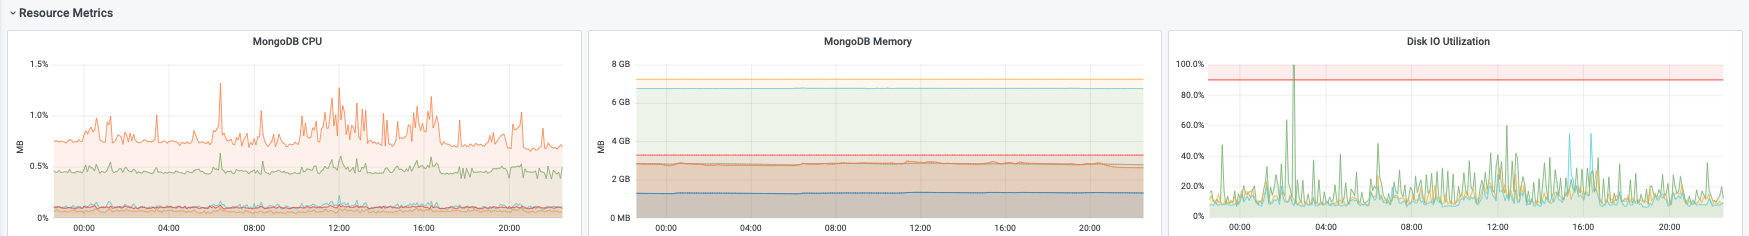
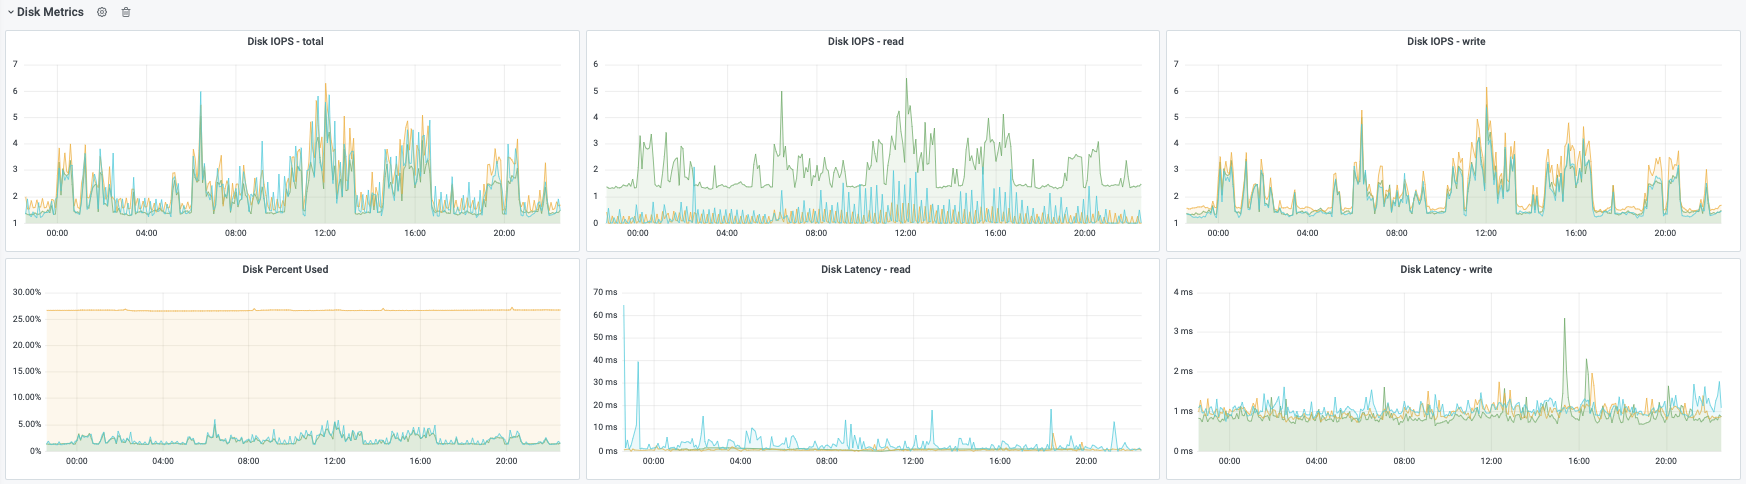
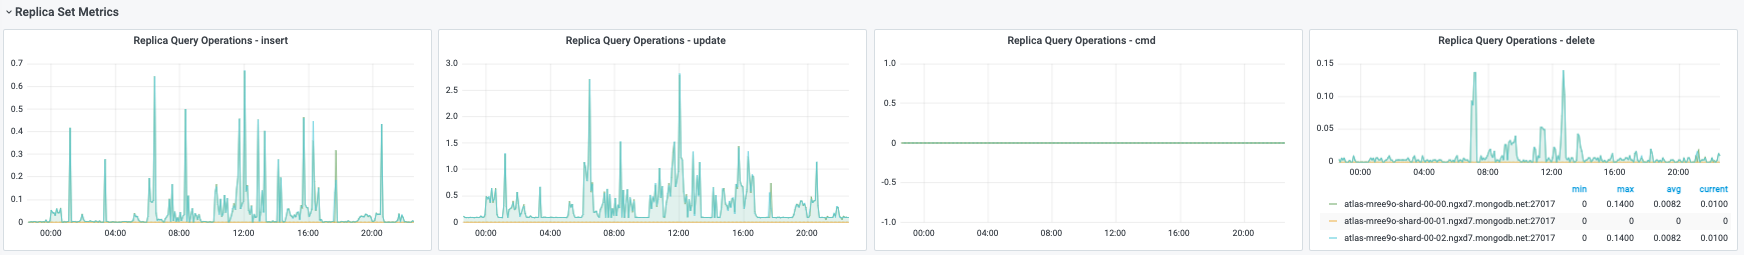
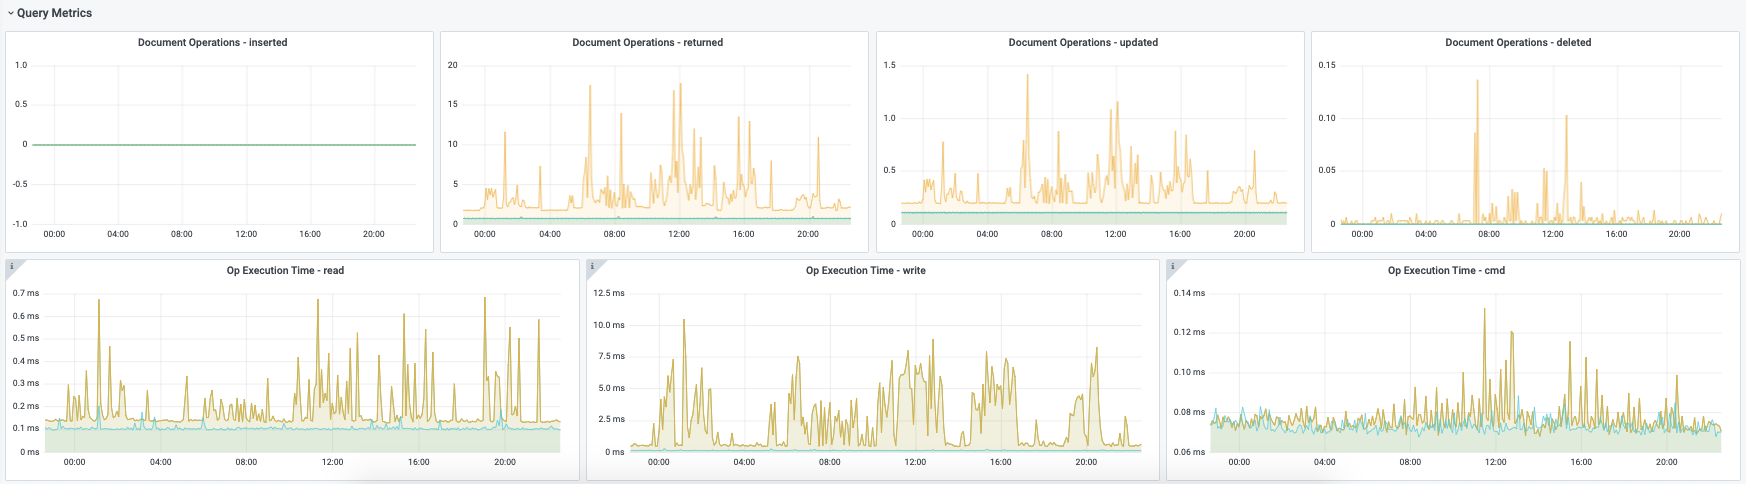
MongoDB Atlas Dashboard
This dashboard uses Grafana MongoDB Atlas Logs Datasource and allows to fetch process, database, and disk logs from MongoDB Atlas API in your Grafana dashboard. All metrics available on MongoDB Atlas API are listed on Measurement Types
Importing
Since datasource doesn’t support Grafana’s template variable, as an attempt to solve this I’m using input values on pre-import to be able to “dynamic” allow customization.
IMPORTANT: This dashboard expects that cluster is a replica set with 3 nodes. If you have more replica sets or even less feel free to change the dashboard before import
Getting the information from MongoDB Atlas Cloud panel
There some information needed to build the dashboard that will need to get from the cloud panel to address the templating issue mentioned above. Also, some information will
Project ID
- Login into the Mongo Atlas Cloud panel
- Click on the Project name link
- The URL will show the ID as follow https://cloud.mongodb.com/v2/[project-id]#clusters
Cluster ID
- Login into the Mongo Atlas Cloud panel
- Click on the Project name link
- On the cluster page click on “Metrics” just below the cluster name
- The URL will show the ID as follow: https://cloud.mongodb.com/v2/5d7bf6609ccf643cd8465d2c#host/replicaSet/[cluster-id]
MONGO_ID
- Login into the Mongo Atlas Cloud panel
- Click on the Project name link
- On the cluster page click on the cluster name
- Click on the link of the
PRIMARYserver name - At the top of the page you will see
ORG > PROJECT > ATLAS-[MONGO_ID]-SHARD-0
DNS_PREFIX
- Login into the Mongo Atlas Cloud panel
- Click on the Project name link
- On the cluster page click on the cluster name
- Click on the link of the
PRIMARYserver name - At the top of the page you will see
cluster-name-shard-00-01.[DNS_PREFIX].mongodb.net:27017
Data source config
Collector config:
Dashboard revisions
Upload an updated version of an exported dashboard.json file from Grafana
| Revision | Decscription | Created | |
|---|---|---|---|
| Download |
Get this dashboard
Data source:
Dependencies: