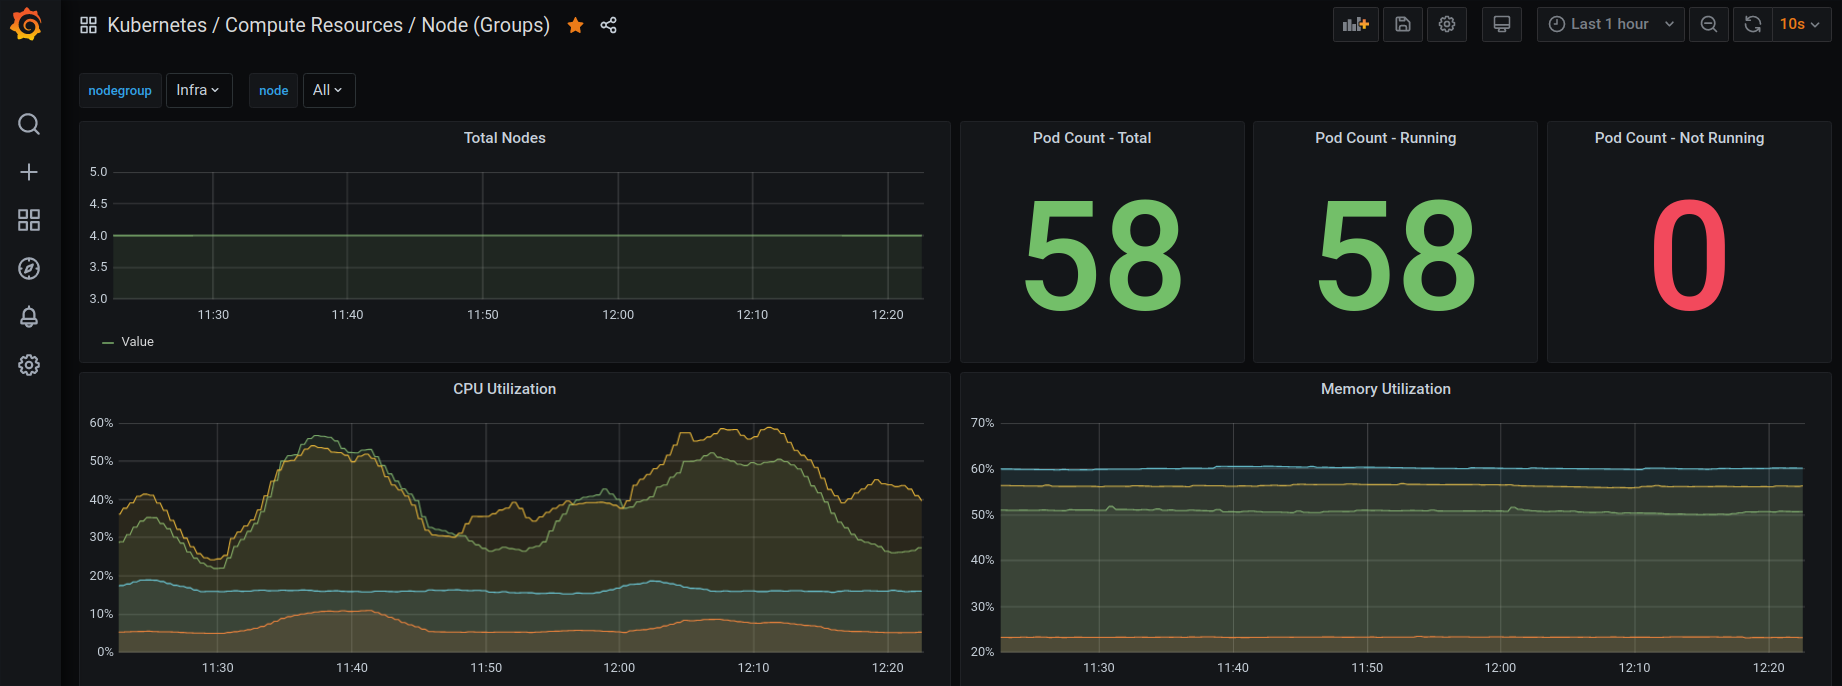
Kubernetes / Compute Resources / Node (Groups)
Grafana dashboard to monitoring nodes grouped by AWS EKS nodegroup. Bear in mind you need a kubernetes label called "nodegroup" in each compute < Node Groups
Bear in mind these points:
- you need a kubernetes label called "nodegroup" in each compute < Node Groups (from AWS UI)
- the instance variable is filtering by host_ip wich not include the port adress so you may need to add it manualy in each panel (in my case the port was 9100)
Data source config
Collector type:
Collector plugins:
Collector config:
Revisions
Upload an updated version of an exported dashboard.json file from Grafana
| Revision | Description | Created | |
|---|---|---|---|
| Download |
Kubernetes
Monitor your Kubernetes deployment with prebuilt visualizations that allow you to drill down from a high-level cluster overview to pod-specific details in minutes.
Learn more
