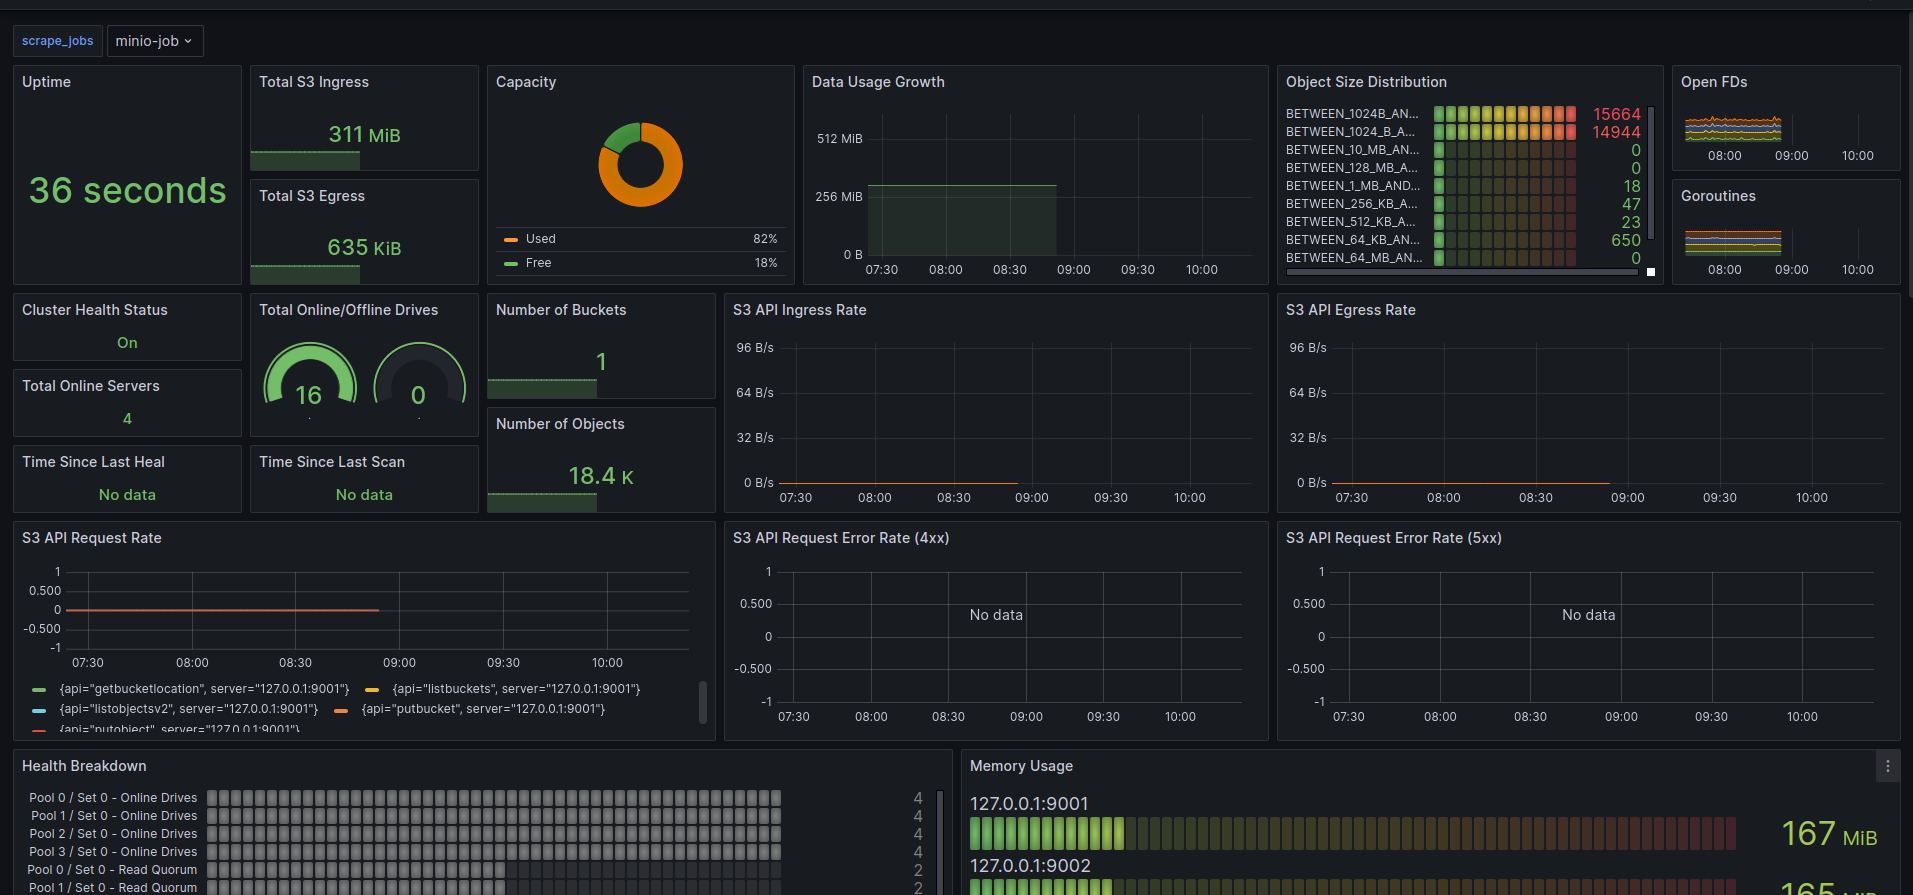
MinIO Dashboard
MinIO Grafana Dashboard - https://min.io/
Introduction
MinIO's high-performance object storage suite is software defined and enables customers to build cloud-native data infrastructure for machine learning, analytics and application data workloads. Read more here.
Prometheus Configuration
MinIO Prometheus endpoint exposes detailed metrics about various sub-systems.
The Prometheus endpoint in MinIO requires authentication by default. Prometheus supports a bearer token approach to authenticate prometheus scrape requests, override the default Prometheus config with the one generated using mc. To generate a Prometheus config for an alias, use mc as follows mc admin prometheus generate <alias>
To allow public access without authentication for Prometheus metrics set environment MINIO_PROMETHEUS_AUTH_TYPE="public"
scrape_configs:
- job_name: minio-job
  bearer_token: <secret>
  metrics_path: /minio/v2/metrics/cluster
  scheme: http
  static_configs:
  - targets: ['localhost:9000']
For further details, refer MinIO Prometheus docs.
Contributing
Report any issues or submit improvements on MinIO GitHub Repository.
Data source config
Collector config:
Upload an updated version of an exported dashboard.json file from Grafana
| Revision | Description | Created | |
|---|---|---|---|
| Download |
MinIO
Easily monitor Minio, a Kubernetes-native high-performance object storage server, with Grafana Cloud's out-of-the-box monitoring solution.
Learn more