Kubernetes Pods monitoring via Prometheus
Kubernetes pods dashboard for Prometheus 2.22.1 Credit to dashboards 3146 and 10324
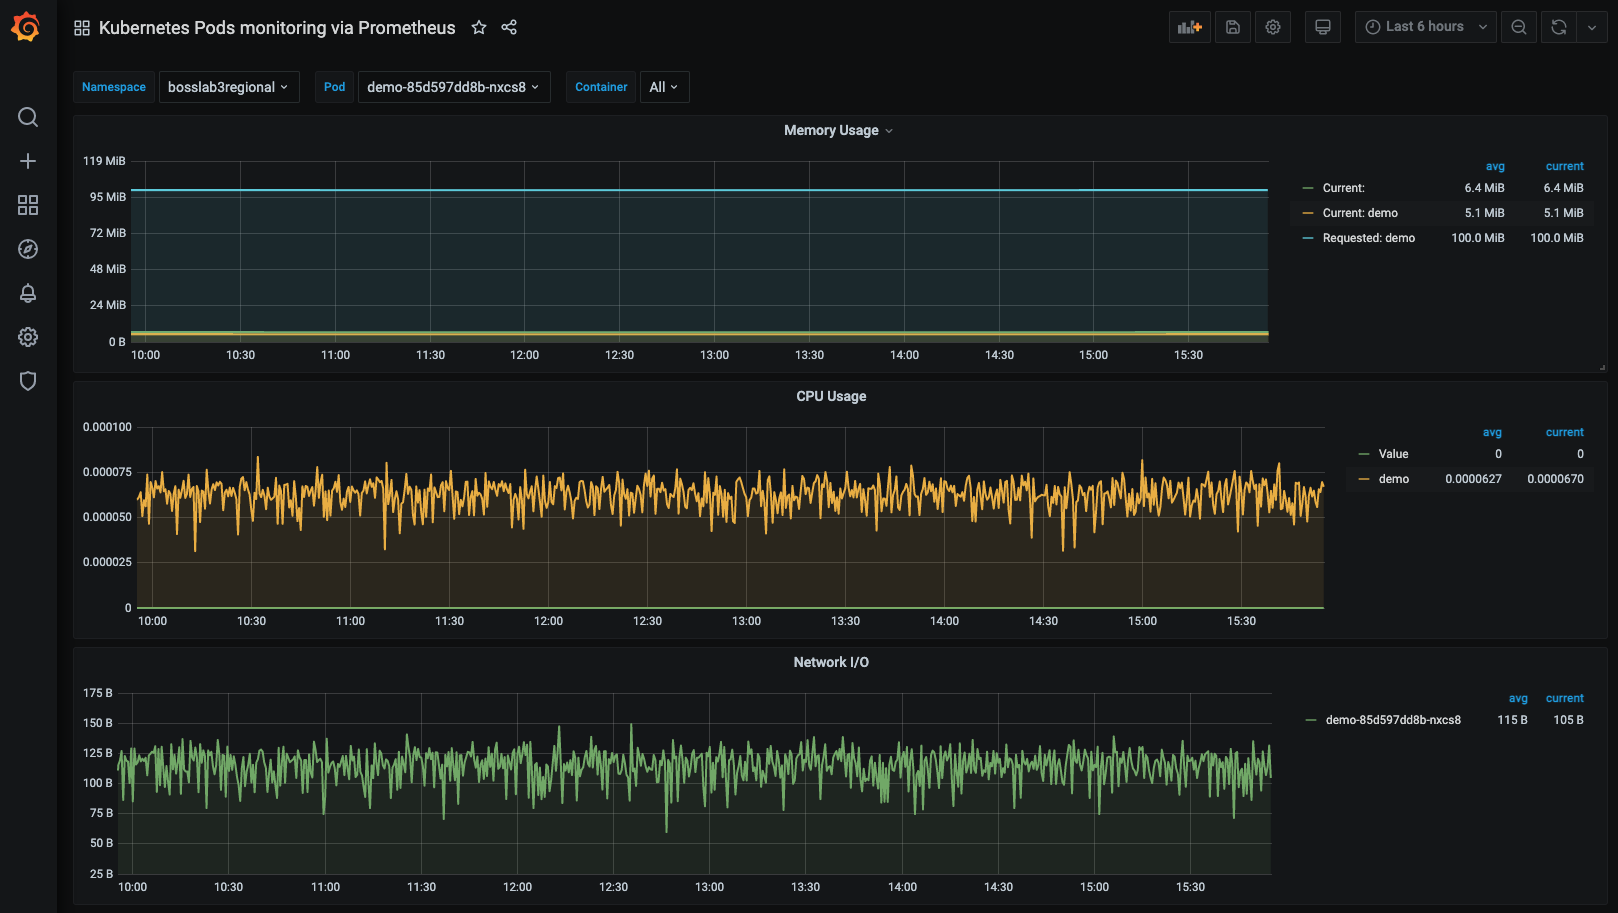
The Kubernetes Pods monitoring via Prometheus dashboard uses the prometheus data source to create a Grafana dashboard with the graph panel.
Data source config
Collector type:
Collector plugins:
Collector config:
Revisions
Upload an updated version of an exported dashboard.json file from Grafana
| Revision | Description | Created | |
|---|---|---|---|
| Download |
Kubernetes
Monitor your Kubernetes deployment with prebuilt visualizations that allow you to drill down from a high-level cluster overview to pod-specific details in minutes.
Learn more