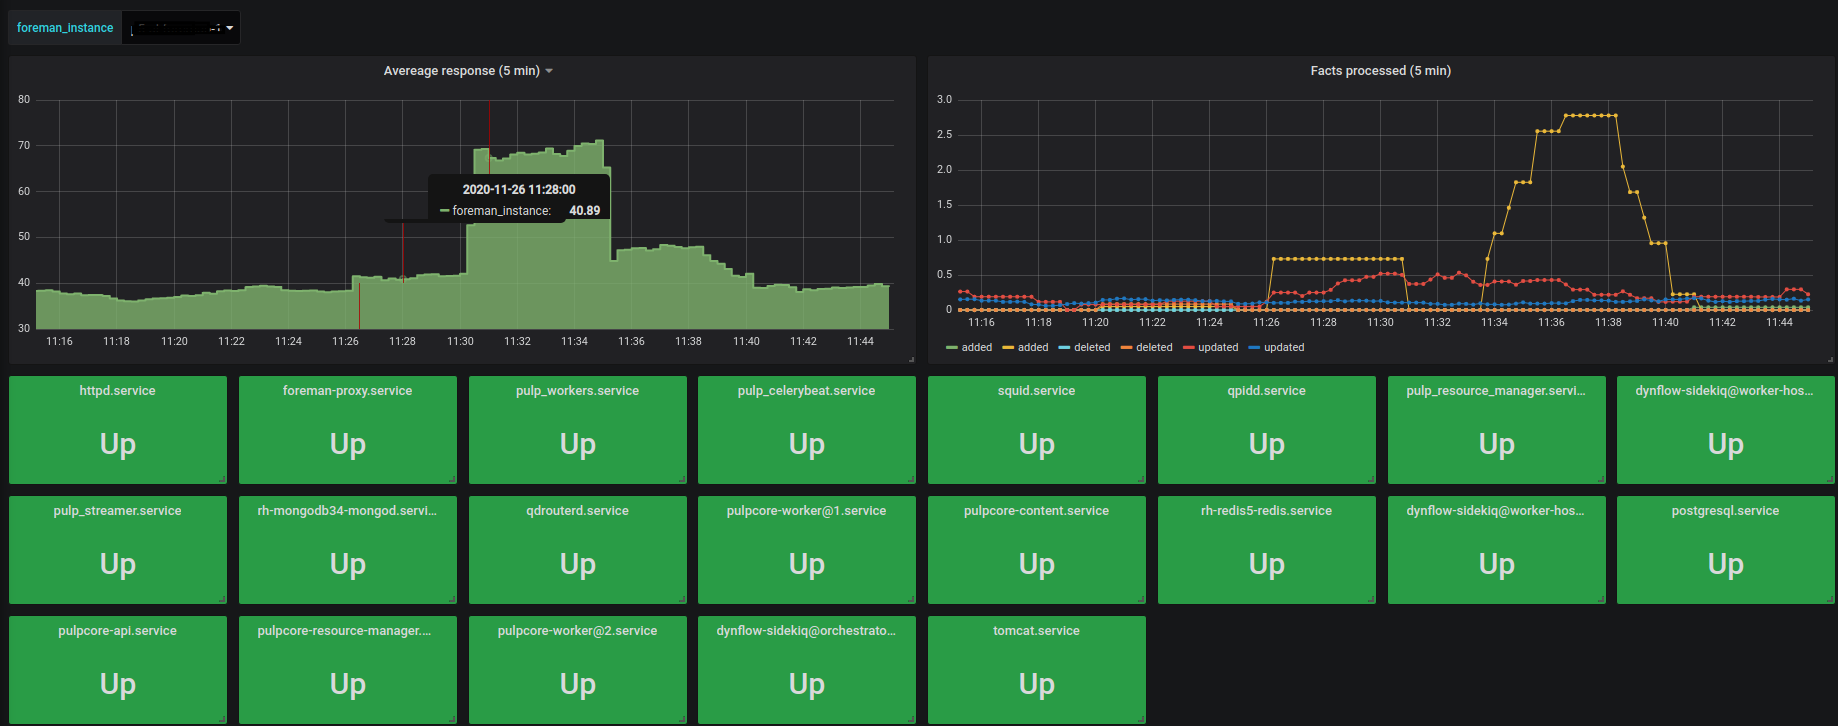
Foreman Katello
Dashboard is for prometheus, and it combines 2 metrics sources. Foreman metrics and node exporter systemd/disk/cpu collector. Monitors - cluster performance, service uptime, cpu/ram/disk
Configure Prometheus to have 2 jobs and use labels, like this:
scrape_configs:
job_name: foreman_cluster_stats
sample_limit: 60000
scheme: https
tls_config:
insecure_skip_verify: true
static_configs:
targets: ['foreman-master.example.com:443']
labels: {location: 'eu-central-1', foreman_type: 'master', foreman_instance: 'foreman-master'}
job_name: foreman_server_stats
sample_limit: 60000
static_configs:
targets: ['foreman-master.example.com:3100']
labels: {location: 'eu-central-1', foreman_type: 'master', foreman_instance: 'foreman-master'}
targets: ['foreman-smartproxy1.example.com:3100']
labels: {location: 'eu-central-1', foreman_type: 'smartproxy', foreman_instance: 'foreman-smartproxy1'}
targets: ['foreman-smartproxy2.example.com:3100']
labels: {location: 'us-east-1', foreman_type: 'smartproxy', foreman_instance: 'foreman-smartproxy2'}
Data source config
Collector config:
Upload an updated version of an exported dashboard.json file from Grafana
| Revision | Description | Created | |
|---|---|---|---|
| Download |

