Prometheus 2.22
Overview of metrics from Prometheus 2.0. Useful for using prometheus to monitor your prometheus. Revisions welcome!
Pormetheus Overview
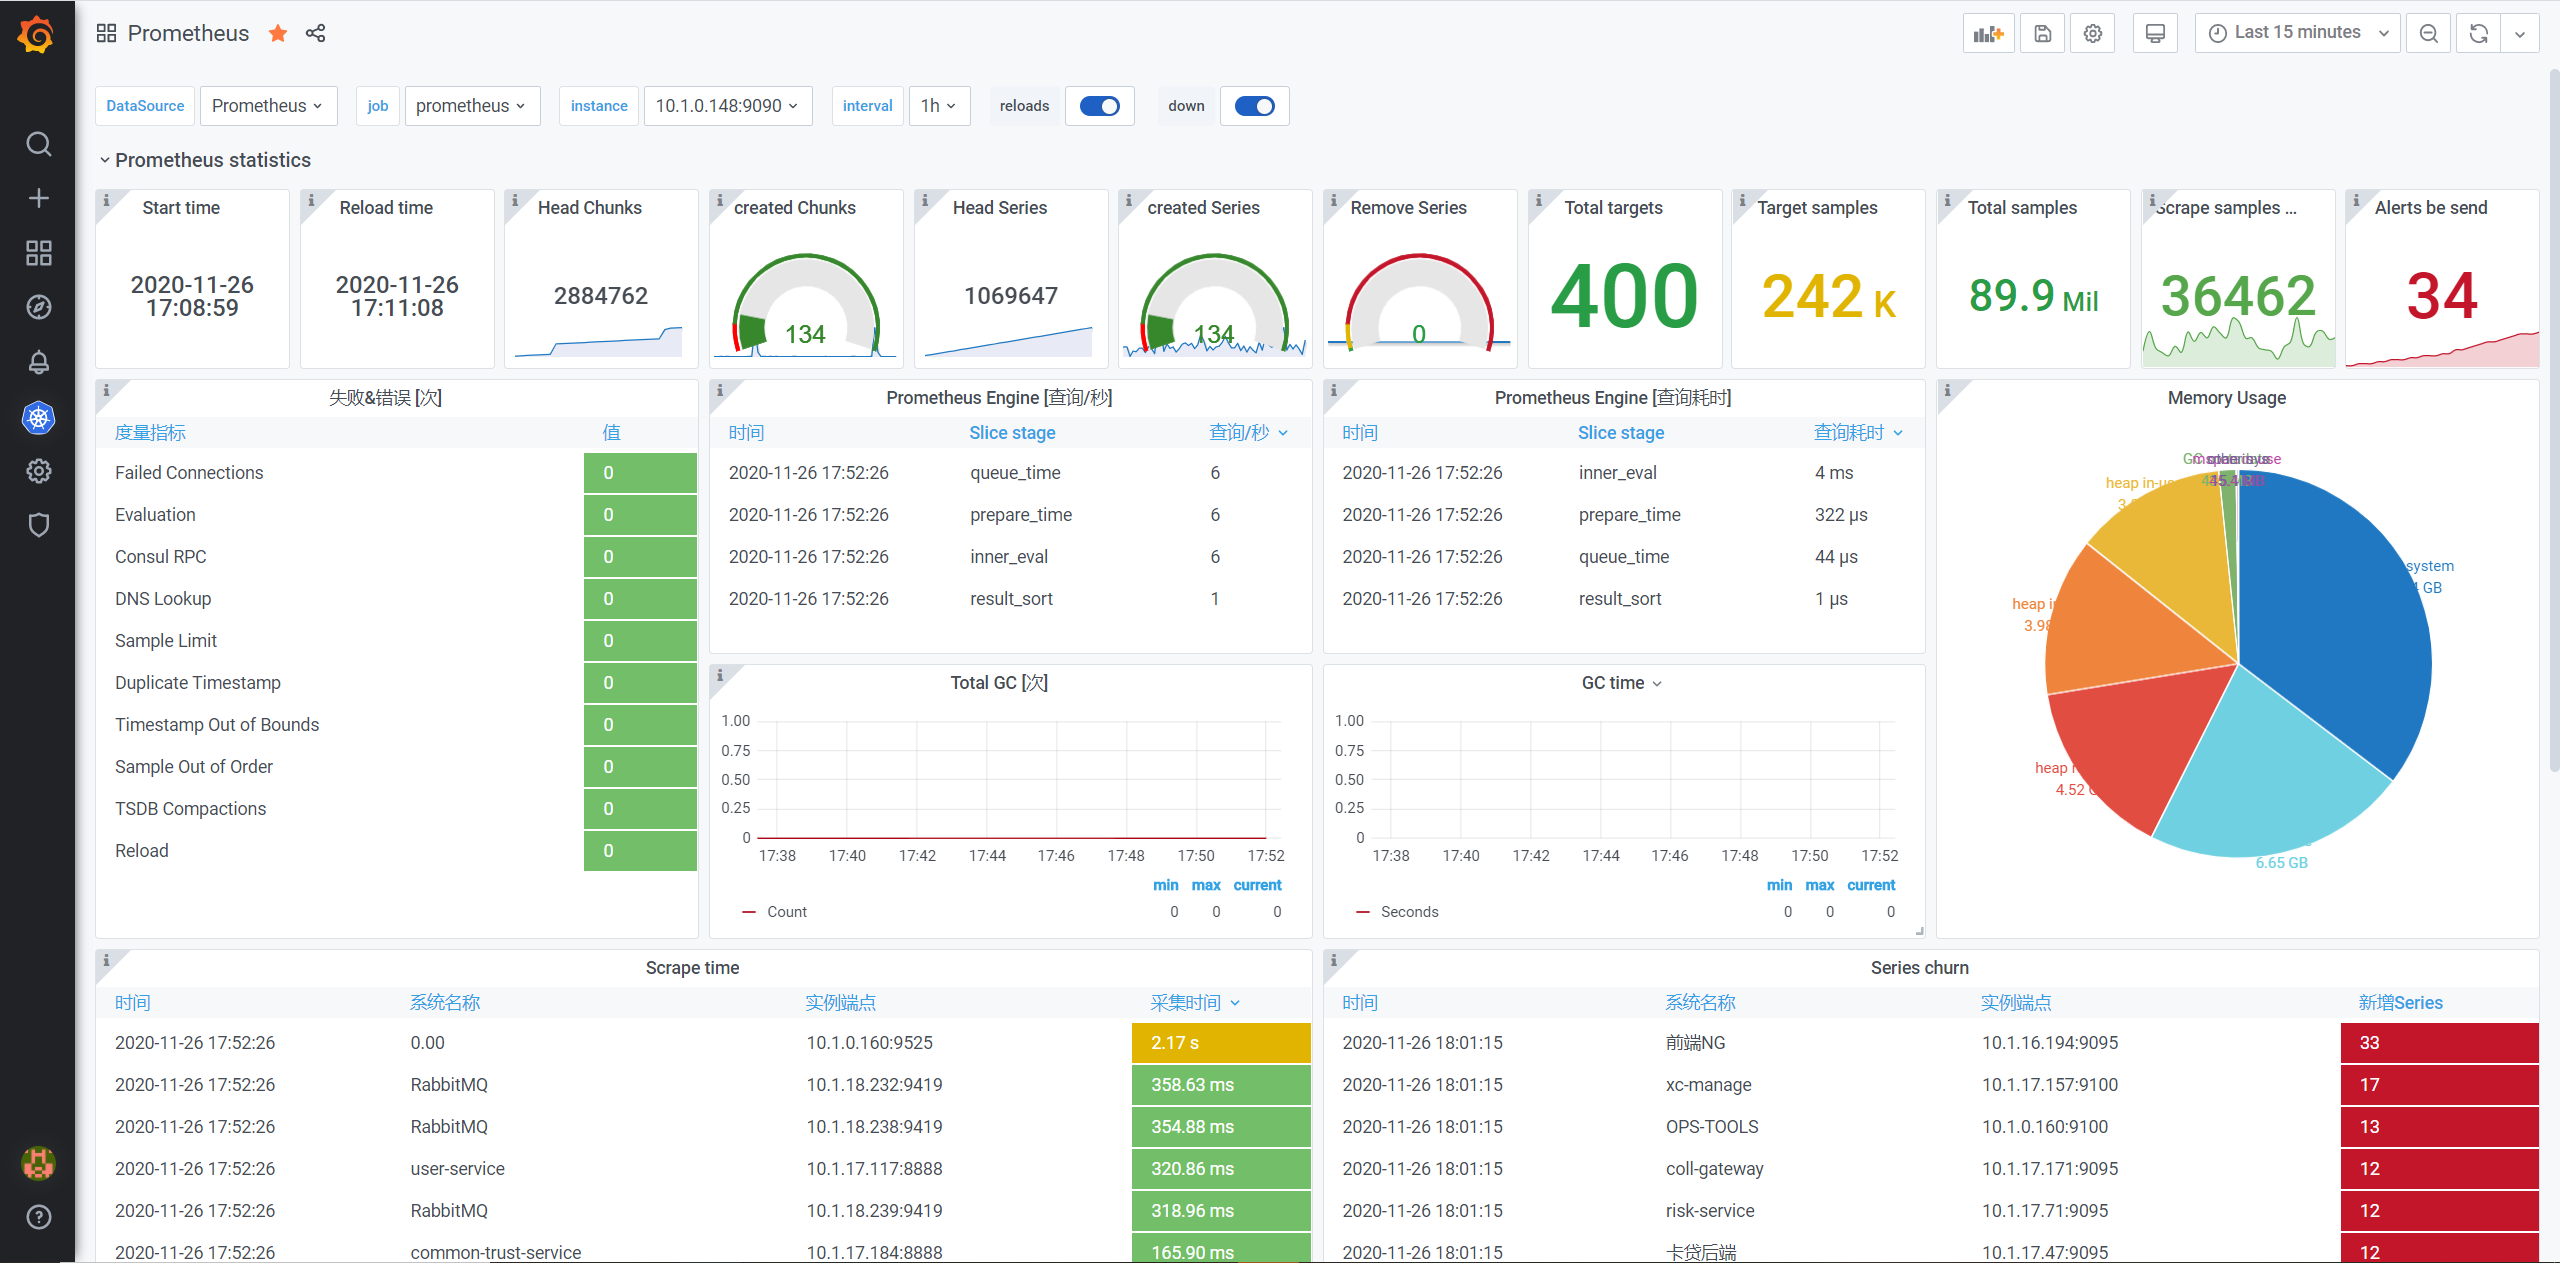
1、add prometheus start time & configraiton file reload time and chunk/series/target/samples/alerts statistics
2、add prometheus engine infomation and memory utilization and GC
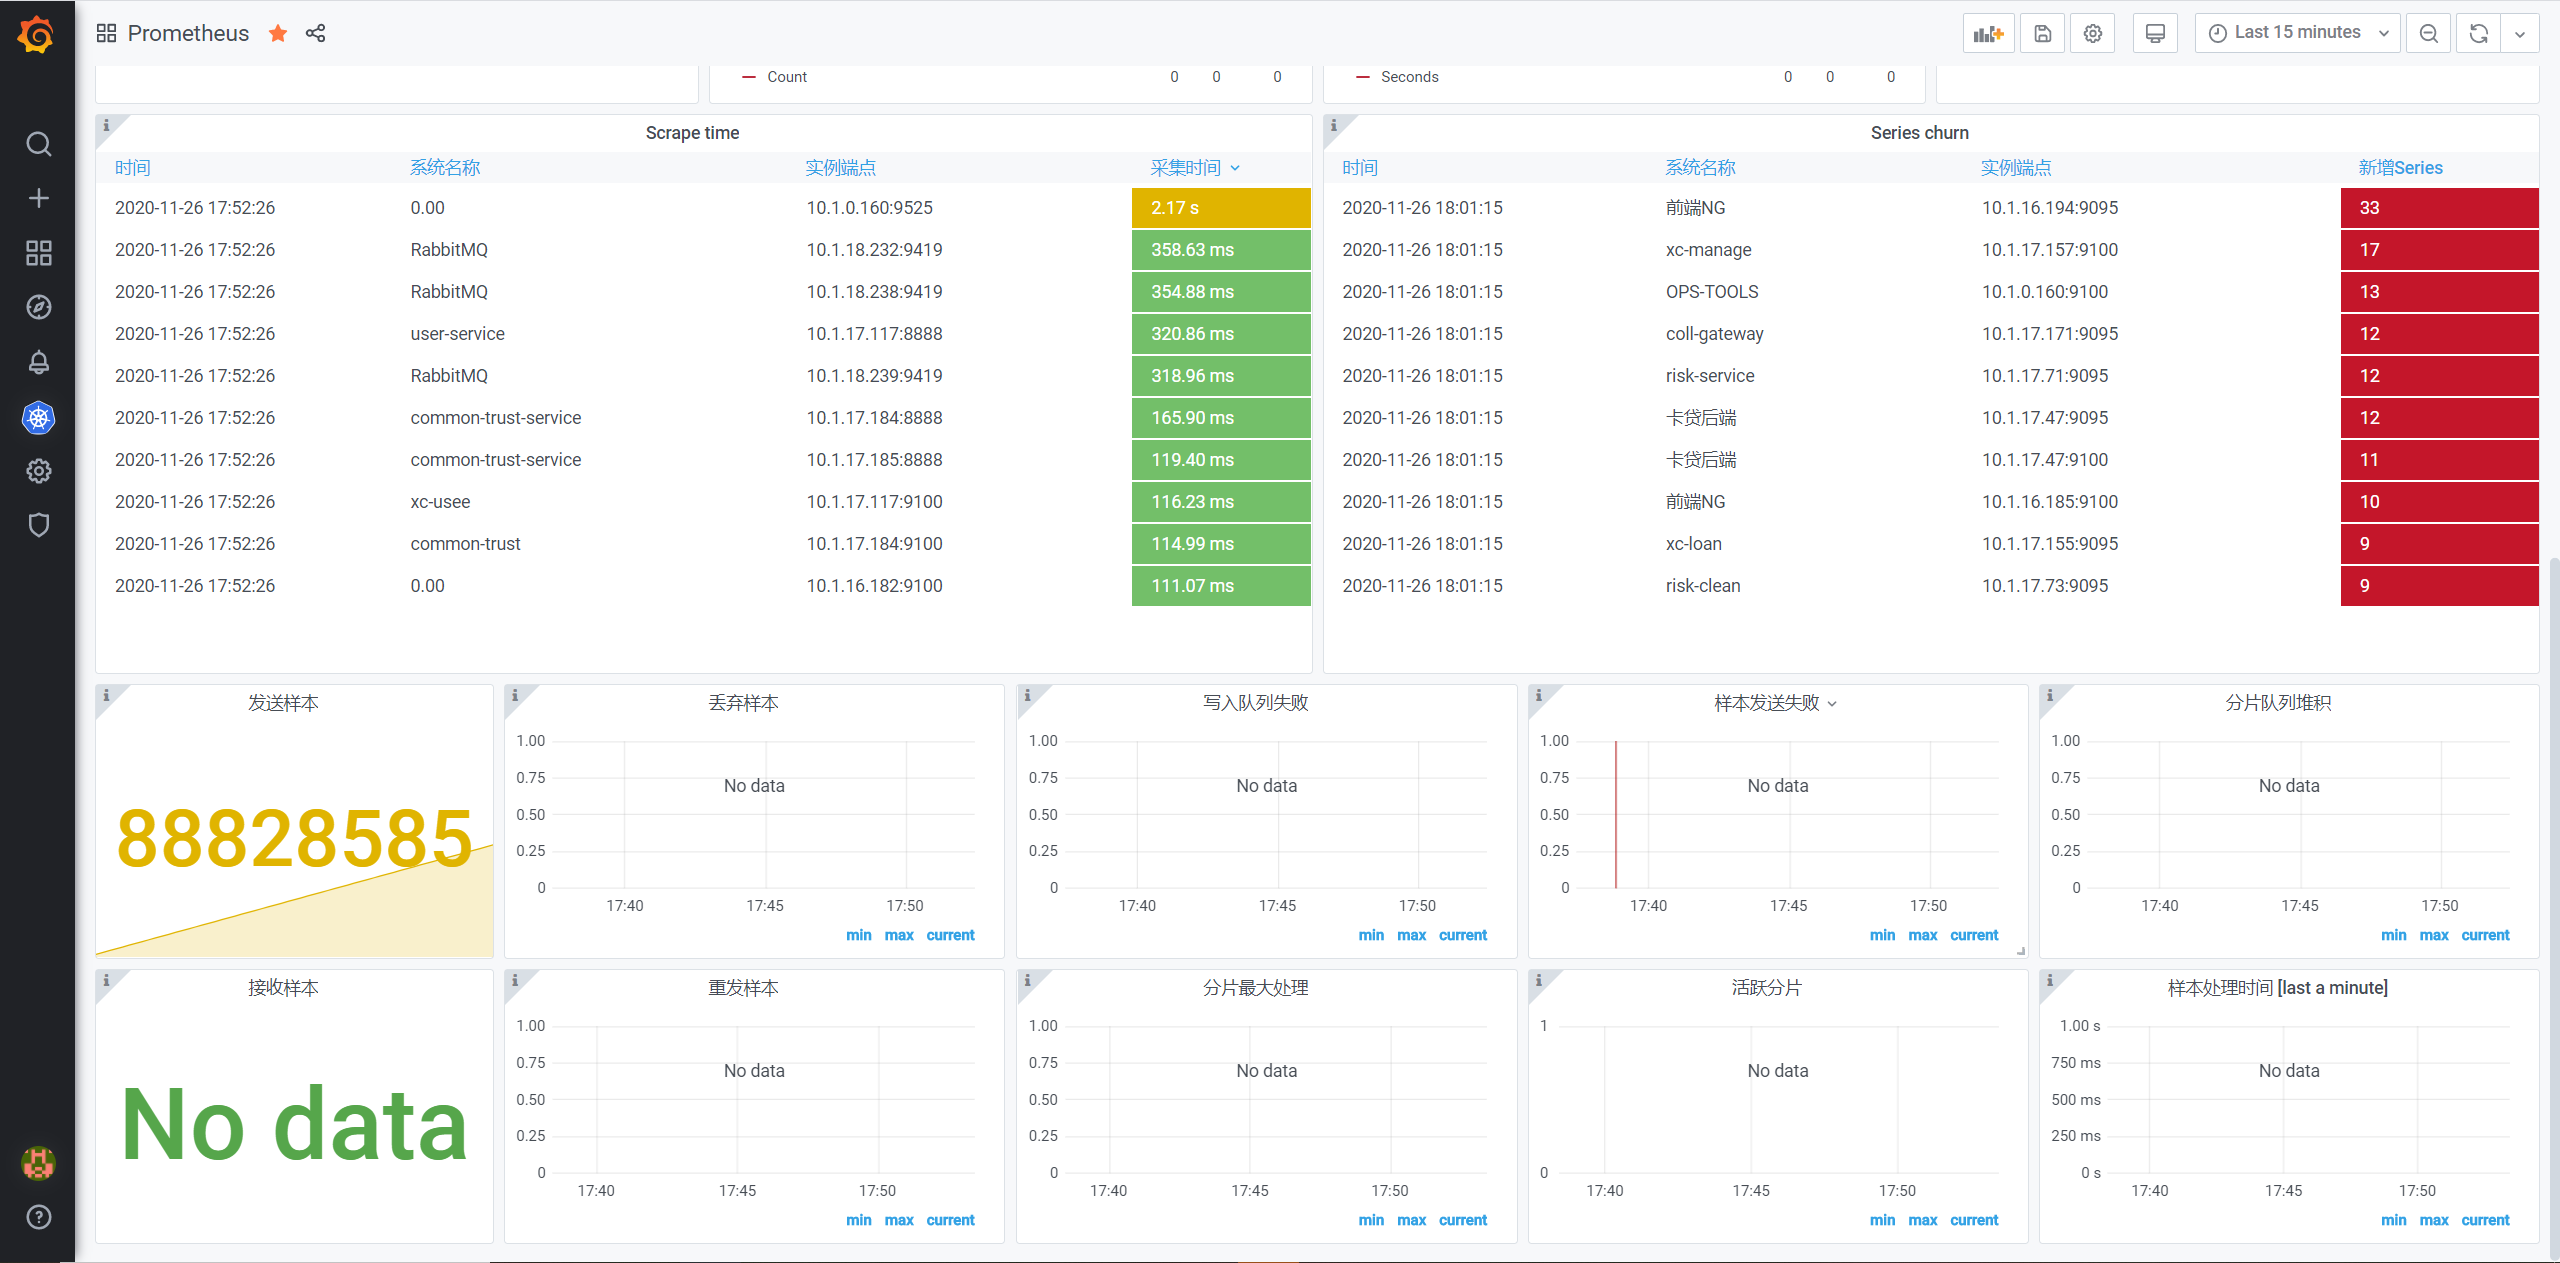
3、add prometheus scrape time and estimate of churn, with series being added to the cache being considered churn. This will have both false positives (e.g. series appearing and disappearing) and false negatives (e.g. series hit sample_limit, but still created in head block), but should be generally useful as-is
4、add remote storage's send samples&recive smaples and share utilization
Data source config
Collector config:
Upload an updated version of an exported dashboard.json file from Grafana
| Revision | Description | Created | |
|---|---|---|---|
| Download |
Metrics Endpoint (Prometheus)
Easily monitor any Prometheus-compatible and publicly accessible metrics URL with Grafana Cloud's out-of-the-box monitoring solution.
Learn more