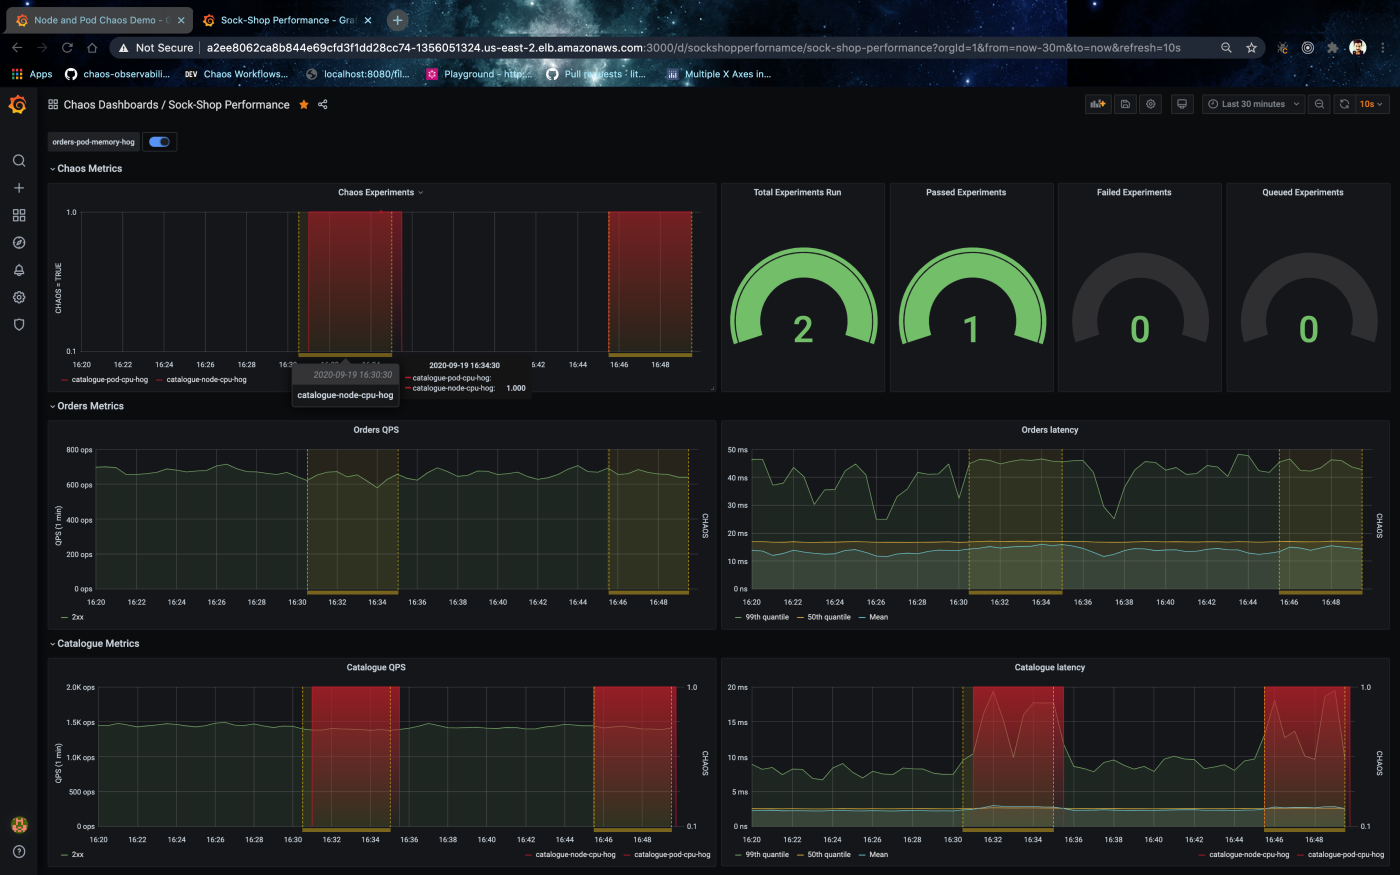
Sock-Shop Performance
Monitor and visualise Sock Shop application metrics metrics interleaved with chaos events and chaos exporter metrics from LitmusChaos.
LitmusChaos facilitates real-time monitoring for events using litmus event router and for metrics using our native chaos exporter. These events and metrics can be exported into any TSDBs (Time-series databases) to overlay on top of application performance graphs and also as additional visualizations for chaos testing statistics. To set up or configure your monitoring infrastructure to support litmus chaos events and metrics, we provide both service endpoints and service monitors setup and pre-configured Grafana dashboards overlayed with chaos events and gauges for chaos experiment statistics. Interleaving application dashboards can be achieved by using a TSDB data source configured for litmus metrics and events. To inject or schedule application or workload specific chaos and monitor using Grafana visit hub.litmuschaos.io
Steps to setup the monitoring infrastructure for collecting metrics and visualising the same using Grafana to monitor application behaviour and resilience during chaos testing.
Setup prometheus TSDB
Model-1 (optional): Service monitor and prometheus operator model.
Create the operator to instantiate all prometheus CRDs
Deploy monitoring components, application service monitors, litmus metrics exporters with corresponding service monitors.
Deploy prometheus instance and all the service monitors for targets
Model-2 (optional): Prometheus scrape config model.
Deploy prometheus components
Deploy metrics exporters, namely litmus-event-router and chaos-exporter.
Add the prometheus datasource from monitoring namespace as DS_PROMETHEUS for Grafana via the Grafana Settings menu

Download and import this Grafana dashboard "Sock-Shop Performance"

Detailed instructions and resources for setup can be found at docs.litmuschaos.io/docs/next/monitoring and github.com/litmuschaos/litmus/tree/master/monitoring
For more details visit github.com/litmuschaos/litmus or slack.litmuschaos.io
Data source config
Collector config:
Upload an updated version of an exported dashboard.json file from Grafana
| Revision | Description | Created | |
|---|---|---|---|
| Download |

