
PGbouncer
Pgbouncer dashboard for Grafana integrated with Percona PMM as well.
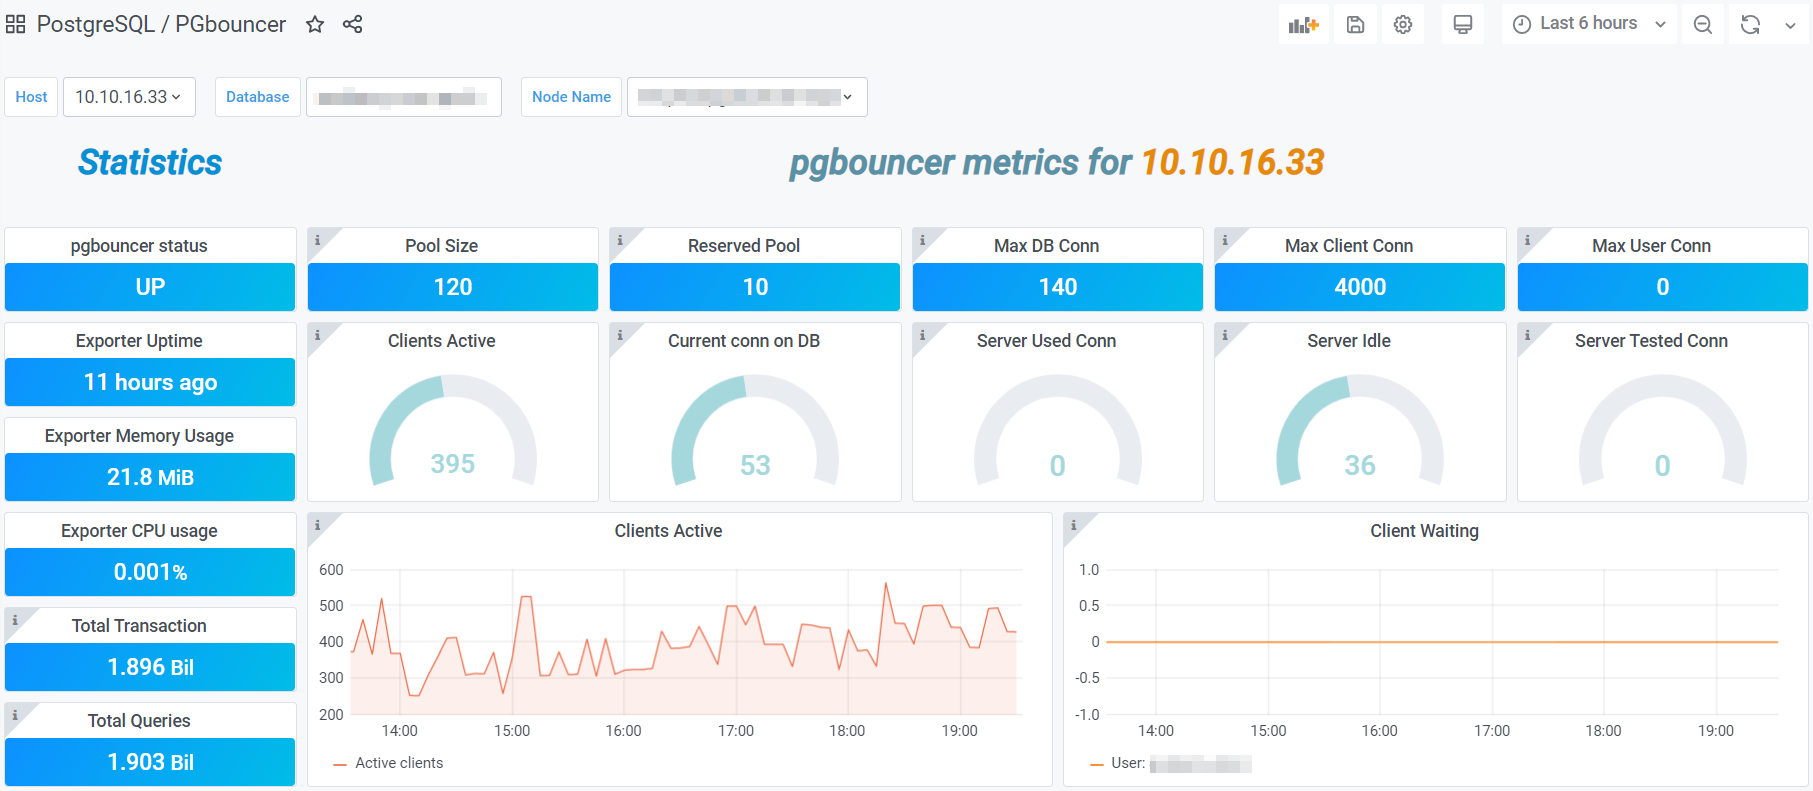
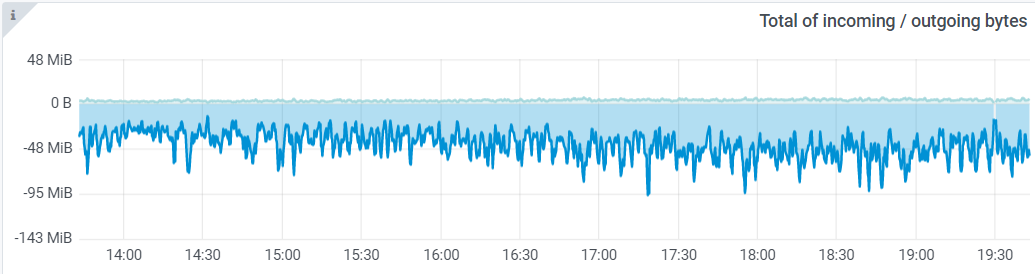
This dashboard works with the pgbouncer exporter and it has the graphs for all the metics. Make you are going to add the additional label called node_ip: your server ip. Because I have created the dashboard to work with node_ip or you can the dashboard JSON file and replace with node_name.
Read my blog on how to setup this exporter to use this dashboard.
Blog Link:https://medium.com/searce/grafana-dashboard-for-pgbouncer-and-monitor-with-percona-pmm-3170d3eb4d14
If you want to contribute and make any new changes, please feel free to give a pull request here.
Data source config
Collector type:
Collector plugins:
Collector config:
Dashboard revisions
Upload an updated version of an exported dashboard.json file from Grafana
| Revision | Decscription | Created | |
|---|---|---|---|
| Download |
Sign up for Grafana Cloud

Get up and running in minutes with the Grafana Cloud free tier, which includes free forever 10k metrics, 50GB logs, 50GB traces, 500 VUh, and more.
Get this dashboard
Data source:
Dependencies: