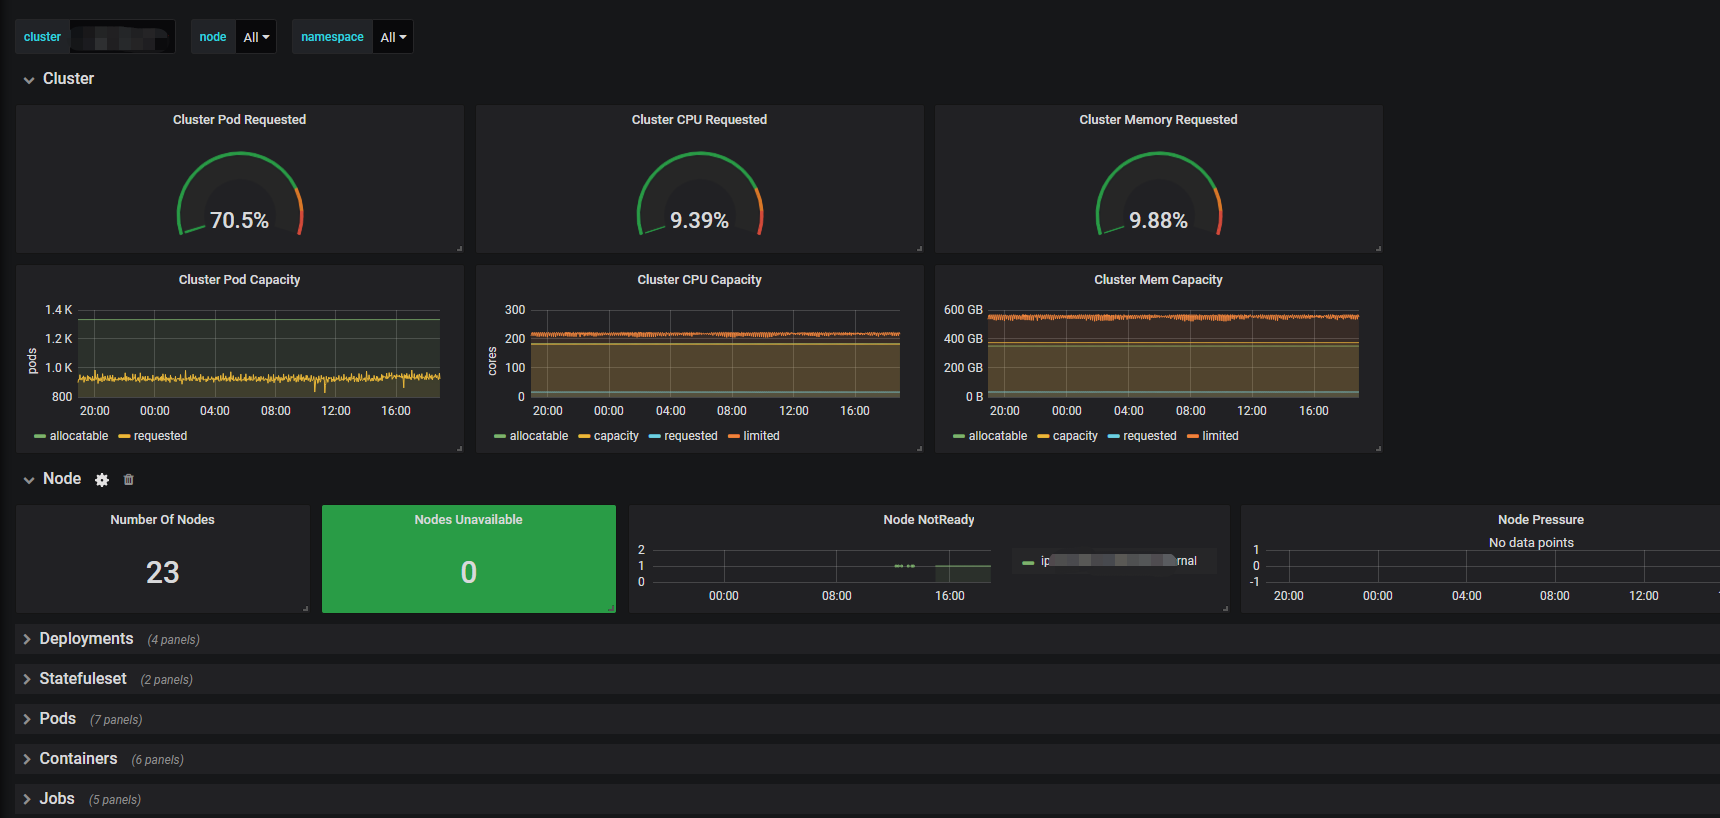
kube-state-metrics-v2
Summary metrics about kube-state-metrics v2 version(https://github.com/kubernetes/kube-state-metrics); Referenced 6417
Prometheus job configuration(配置规范)
- job_name: k8s-kube-state-metrics-YourDefinedK8sClusterName(自定义的k8s集群名字)
honor_timestamps: true
metrics_path: /metrics
scheme: http
static_configs:
  - targets: ['IP:PORT']
metric_relabel_configs:
- target_label: cluster
  replacement: YourDefinedK8sClusterName(自定义的k8s集群名字)
Configuration in Grafana(在Grafana进行配置)
- Notice:
- If you can't click the "import" button when you import the dashboard, you should try to clear the datasource and input it again, maybe the reason is incompatible versions of Grafana. (当import面板时,发现Import按钮无法点击,则可能是因为Grafana版本原因,将datasource内容删掉然后再填入,即可。)
- Update the name of datasource to your datasource name.(修改datasource的值为自己的所定义的数据源名字。)
About Me
- 微信公众号:浪子小鬼 如果有机会,可以关注一下,希望我的思想也能被你看到,作为一种借鉴
- Github: garysdevil
- Discord channel: https://discord.gg/3wy4Xc274y
- Email: adamgarysdevil@gmail.com
- 一位追求 计算机网络技术、金融投资、催眠学、生活享乐 的去中心化自由主义者
Data source config
Collector type:
Collector plugins:
Collector config:
Revisions
Upload an updated version of an exported dashboard.json file from Grafana
| Revision | Description | Created | |
|---|---|---|---|
| Download |
Kubernetes
Monitor your Kubernetes deployment with prebuilt visualizations that allow you to drill down from a high-level cluster overview to pod-specific details in minutes.
Learn more