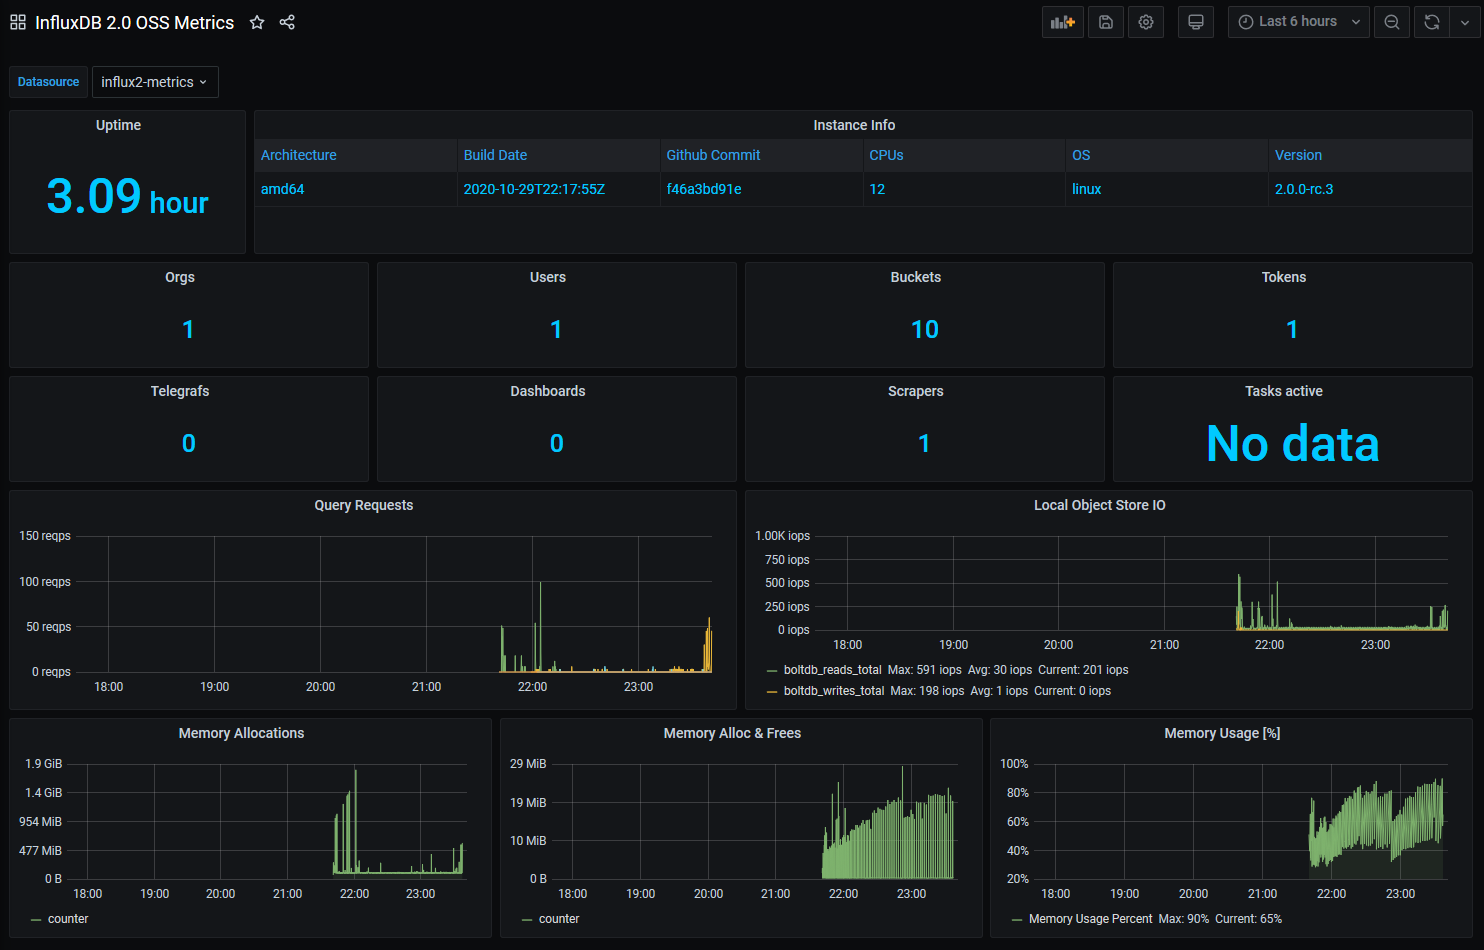
InfluxDB 2.0 OSS Metrics
InfluxDB 2.0 OSS Metrics
Grafana Conversion of the preinstalled Dashboard for DB Metrics that comes with InfluxDB 2.0 OSS. All queries written in Fluxlang. Should work for InfluxDB 2.0 Cloud too.
To make it work you only need to create a Datasource to your InfluxDB 2.0 OSS Instance that has sufficient permissions to read from the _monitoring Bucket.
Data source config
Collector config:
Upload an updated version of an exported dashboard.json file from Grafana
| Revision | Description | Created | |
|---|---|---|---|
| Download |
InfluxDB
Easily monitor InfluxDB, an open source time series database, with Grafana Cloud's out-of-the-box monitoring solution.
Learn more
