
Supervision des services systemd
SystemD services status dashboard for the service.py script feeding Telegraf's exec plugin. ▎ ▎ This is the 1.x dashboard, which expects the legacy status encoding (4 = active, 3 = exited, 2 = inactive, 1 = failed). It keeps working with srvstatus 2.0 as long as settings.ini leaves convention = legacy, which is the default. ▎ ▎ For a multi-host view — availability, alert timeline, host × service matrix and state history — see the v2 dashboard. Script, dashboards and changelog: https://github.com/b4b857f6ee/srvstatus
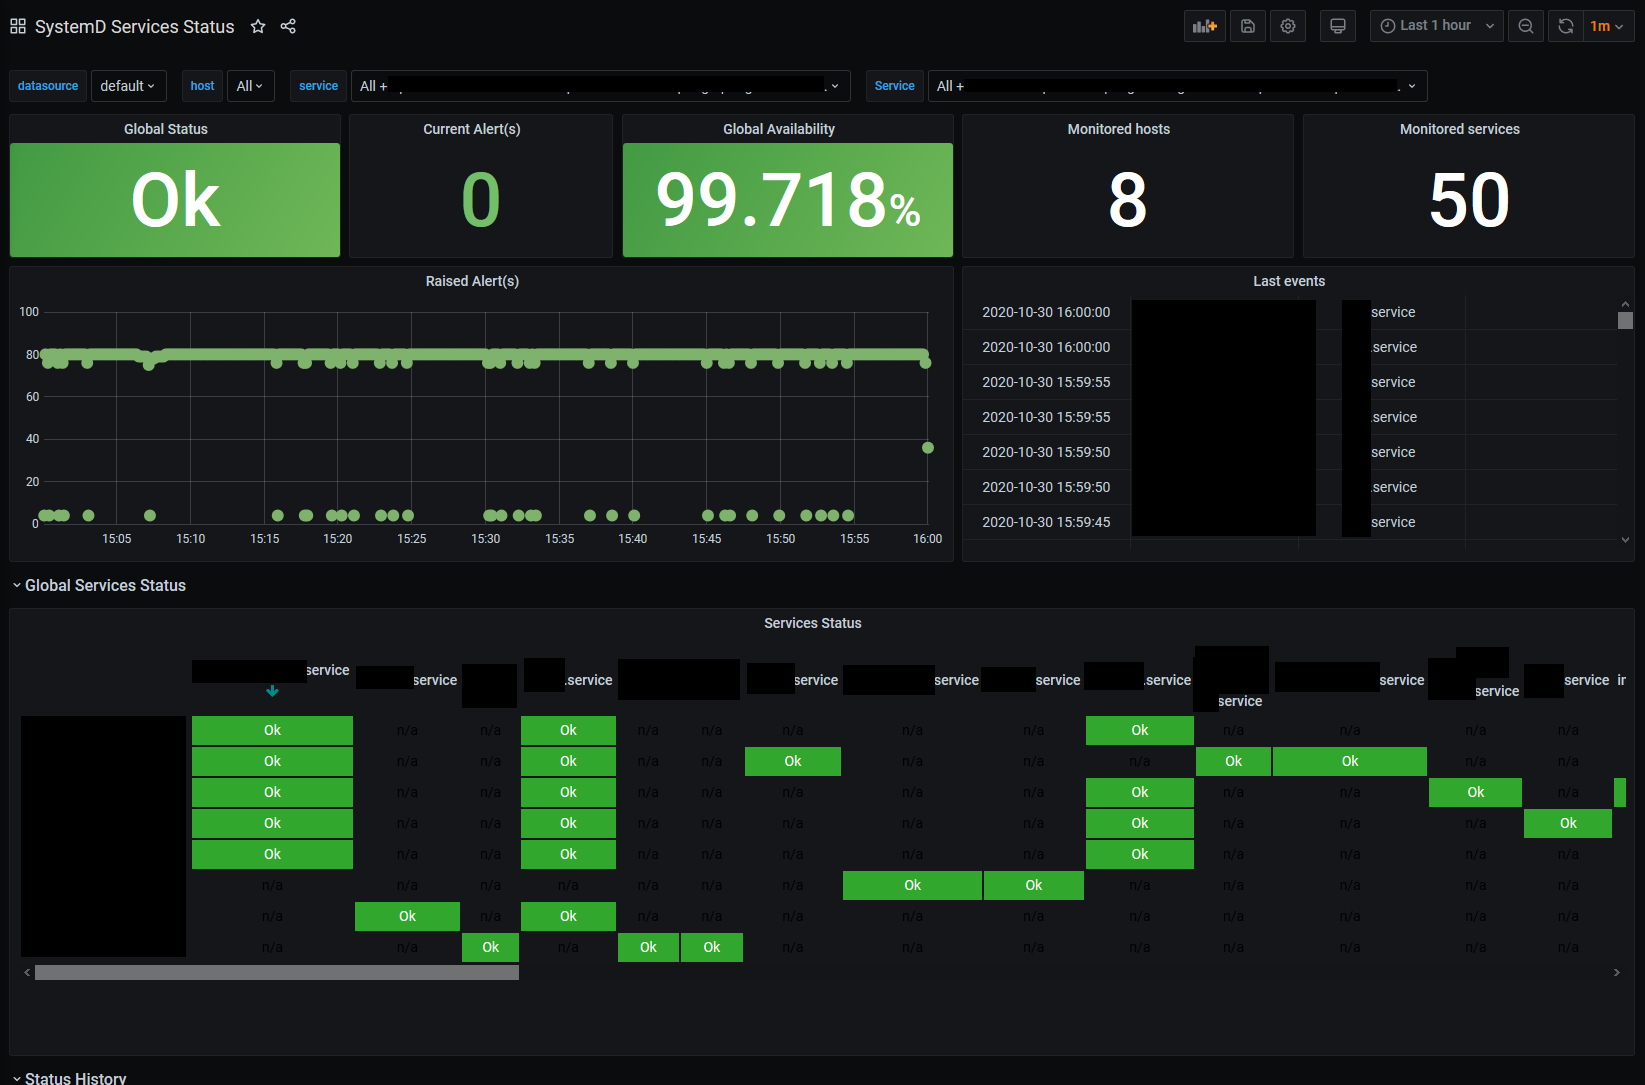
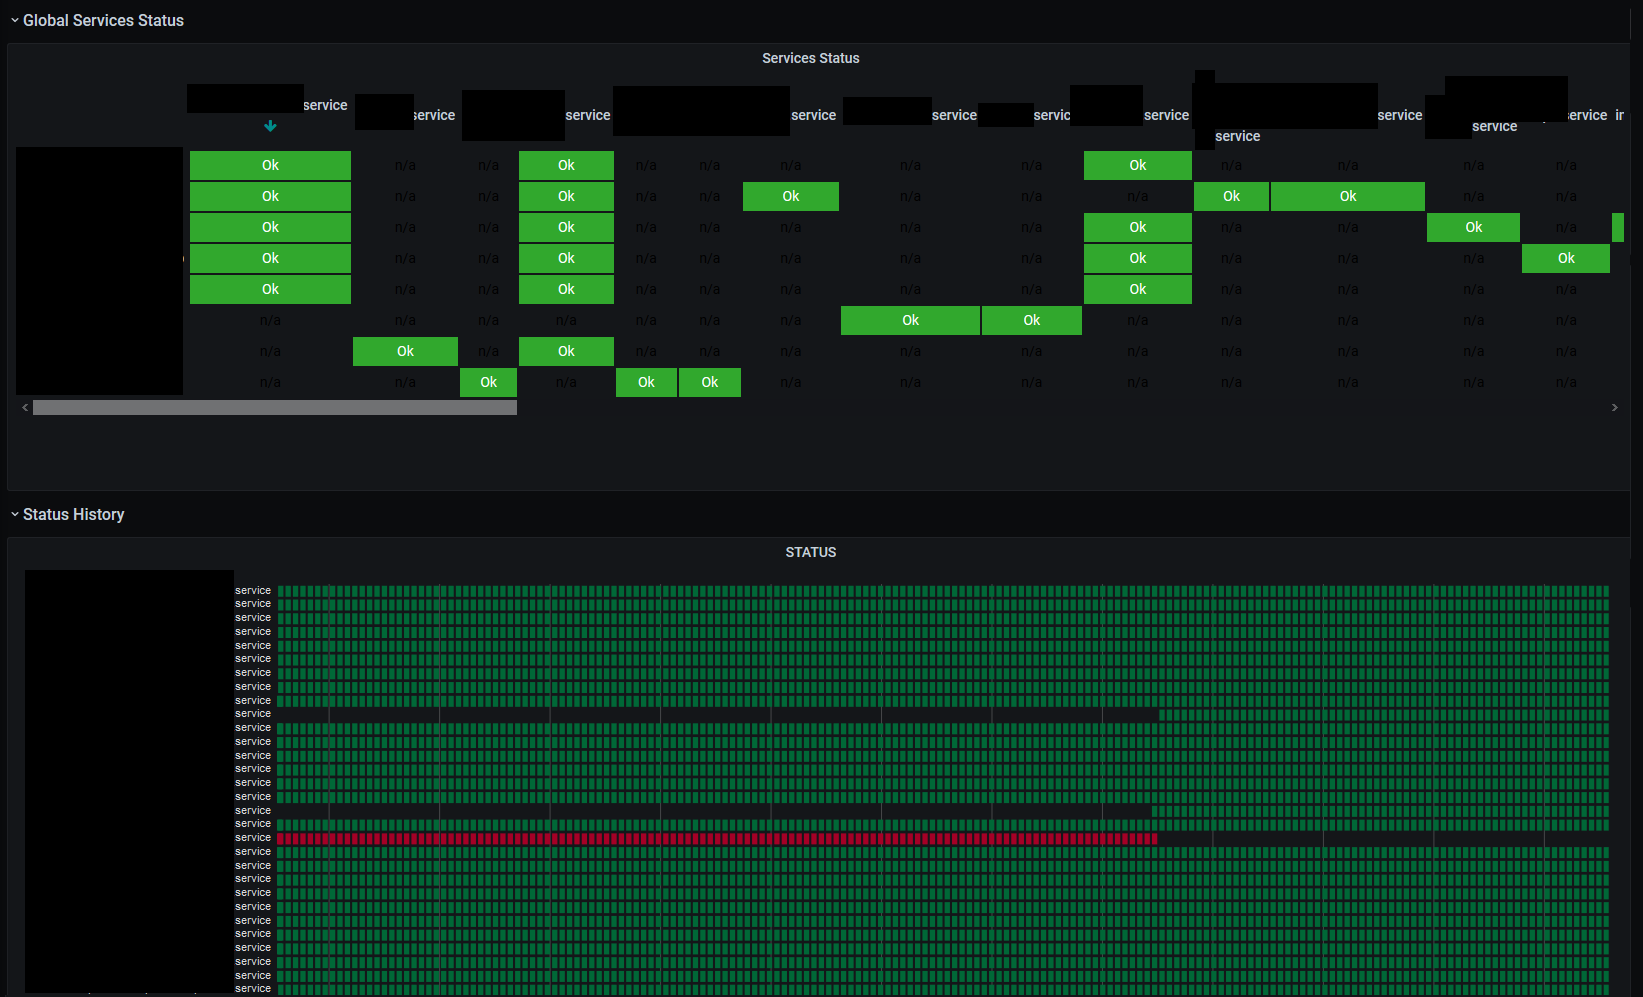
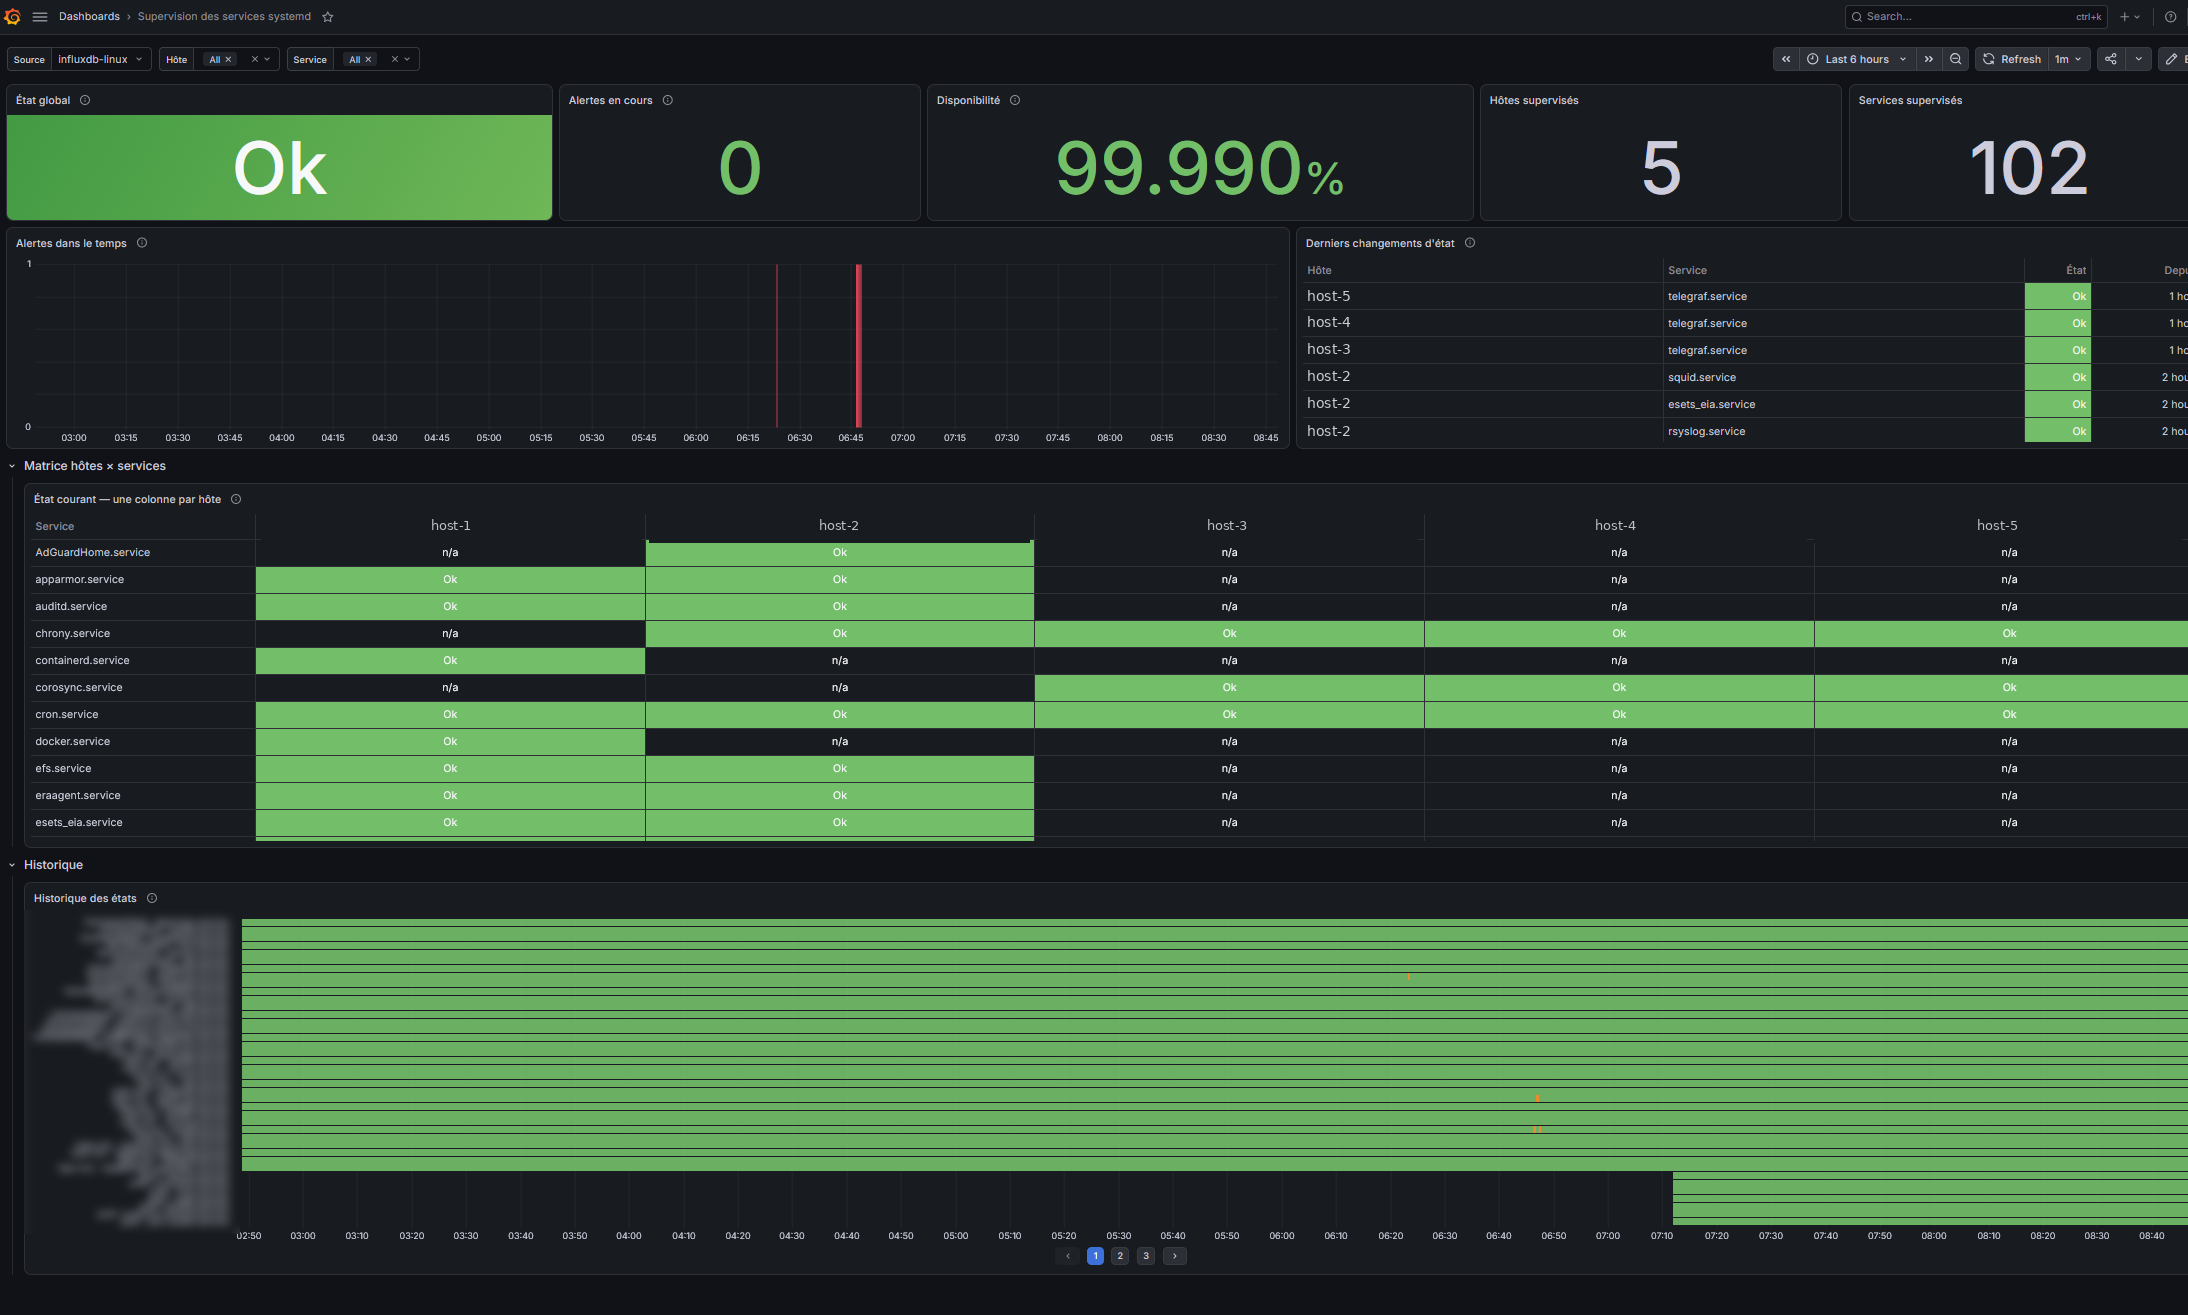
Requires settings.ini listing the units to watch. See https://github.com/b4b857f6ee/srvstatus
Data source config
Collector type:
Collector plugins:
Collector config:
Revisions
Upload an updated version of an exported dashboard.json file from Grafana
| Revision | Description | Created | |
|---|---|---|---|
| Download |