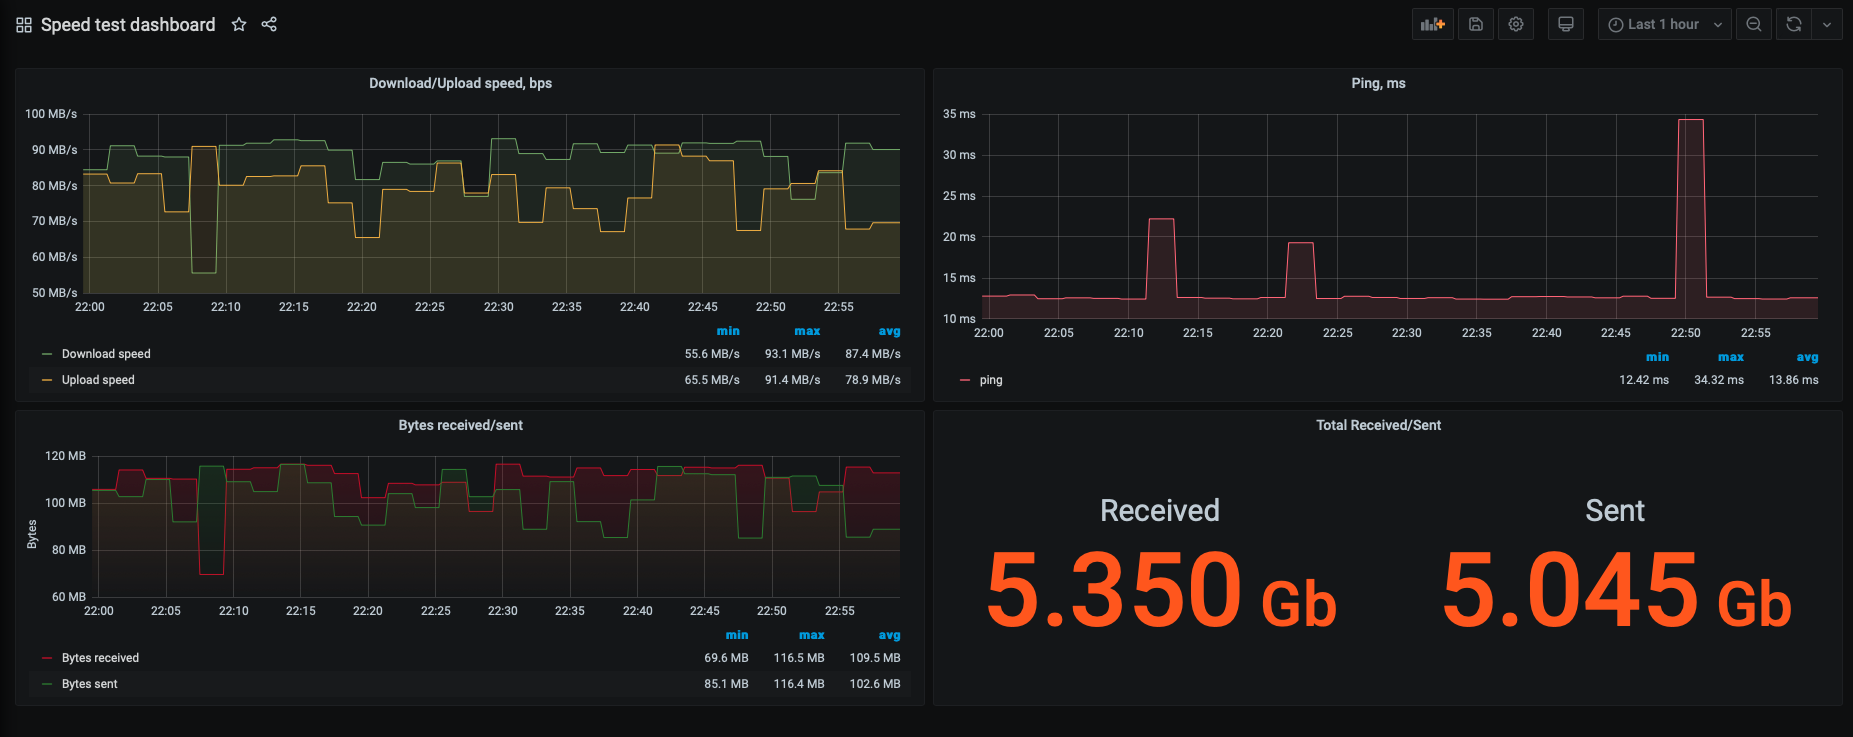
Speedtest dashboard
Dashboard for speediest.net cli prometheus exporter
I used docker, so my solution is pretty universal. If you want quick start docker would be best scenario or you can make everything by yourself.
Prerequisites:
You'll need next
Setup
Run speed test exporter:
docker run -d --net prometheus_network -p 9516:9516/tcp \\
--name prometheus_speedtest jraviles/prometheus_speedtest:latest
Create config file for Prometheus
prometheus.ymlin directory where you going run Prometheus container:global: scrape_interval: 2m scrape_timeout: 2mscrape_configs:
- job_name: 'speedtest'
metrics_path: /probe
static_configs:
- targets:
- prometheus_speedtest:9516
- targets:
- job_name: 'speedtest'
metrics_path: /probe
static_configs:
Run Prometheus:
 docker run -d --net prometheus_network -p 9090:9090/tcp \
 -v $PWD/prometheus/prometheus.yml:/etc/prometheus/prometheus.yml \
 --name prometheus prom/prometheus:latest
Add your prometheus as datasource for your Grafana.
Data source config
Collector config:
Upload an updated version of an exported dashboard.json file from Grafana
| Revision | Description | Created | |
|---|---|---|---|
| Download |

