
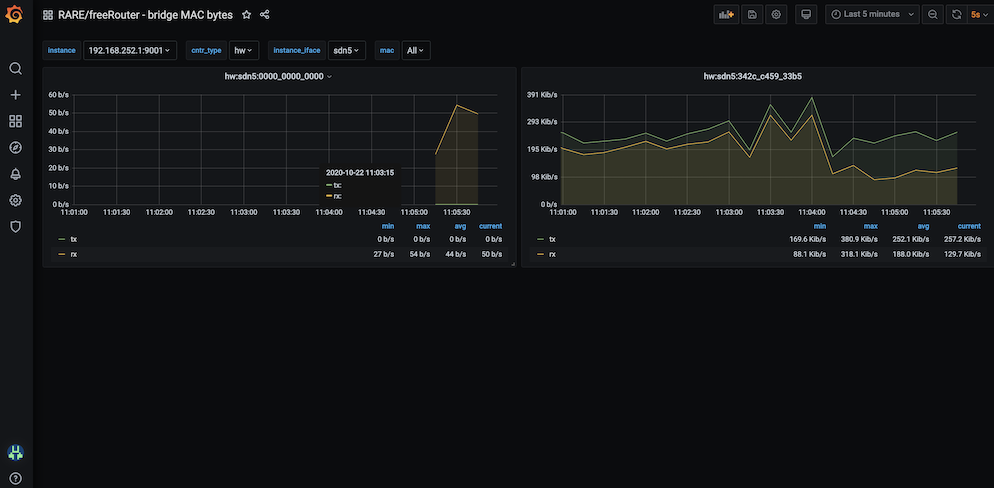
RARE/freeRouter - bridge MAC bytes
Display bridge byte metrics
scope:local to freeRouter node
freeRouter Prometheus configuration: (copy & paste in freeRouter CLI)
- Create hardware and software sensor
sensor bridge
path bridge/peer/peer
prefix freertr-bridge
key name bridge/peer
command sho bridge 1 | beg addr
prepend br_mac_
name 0 mac=
addname 1 * ifc=
replace \. _
column 3 name pack_tx
column 3 split + typ="sw" typ="hw"
column 4 name pack_rx
column 4 split + typ="sw" typ="hw"
column 5 name pack_dr
column 5 split + typ="sw" typ="hw"
column 6 name byte_tx
column 6 split + typ="sw" typ="hw"
column 7 name byte_rx
column 7 split + typ="sw" typ="hw"
column 8 name byte_dr
column 8 split + typ="sw" typ="hw"
.
exit- freeRtr server Prometheus agent configuration
server prometheus pr
 sensor bridge
 vrf <PROMETHEUS_VRF>
exit- Prometheus server configuration (sample config with 2 nodes)
global:
  scrape_interval: 15s
  scrape_timeout: 10s
  evaluation_interval: 30s
alerting:
  alertmanagers:
  - static_configs:
    - targets: []
    scheme: http
    timeout: 10s
scrape_configs:
- job_name: router
  scrape_interval: 15s
  scrape_timeout: 10s
  metrics_path: /metrics
  scheme: http
  static_configs:
  - targets:
    - <prometheus_agent_ip_1>:9001
    labels:
      node_name: <prometheus_agent_1_node_name>
  - targets:
    - <prometheus_agent_ip_2>:9001
    labels:
node_name: <prometheus_agent_2_node_name>Data source config
Collector type:
Collector plugins:
Collector config:
Dashboard revisions
Upload an updated version of an exported dashboard.json file from Grafana
| Revision | Decscription | Created | |
|---|---|---|---|
| Download |
Sign up for Grafana Cloud

Get up and running in minutes with the Grafana Cloud free tier, which includes free forever 10k metrics, 50GB logs, 50GB traces, 500 VUh, and more.
Get this dashboard
Data source:
Dependencies: