Kubernetes Cluster Overview (by Datasource)
This dashboard can help to troubleshoot issues in Kubernetes cluster at cluster, node and namespace level. Calculate SLO and Error Budget without cronjob pod (pod name contains cronjob).
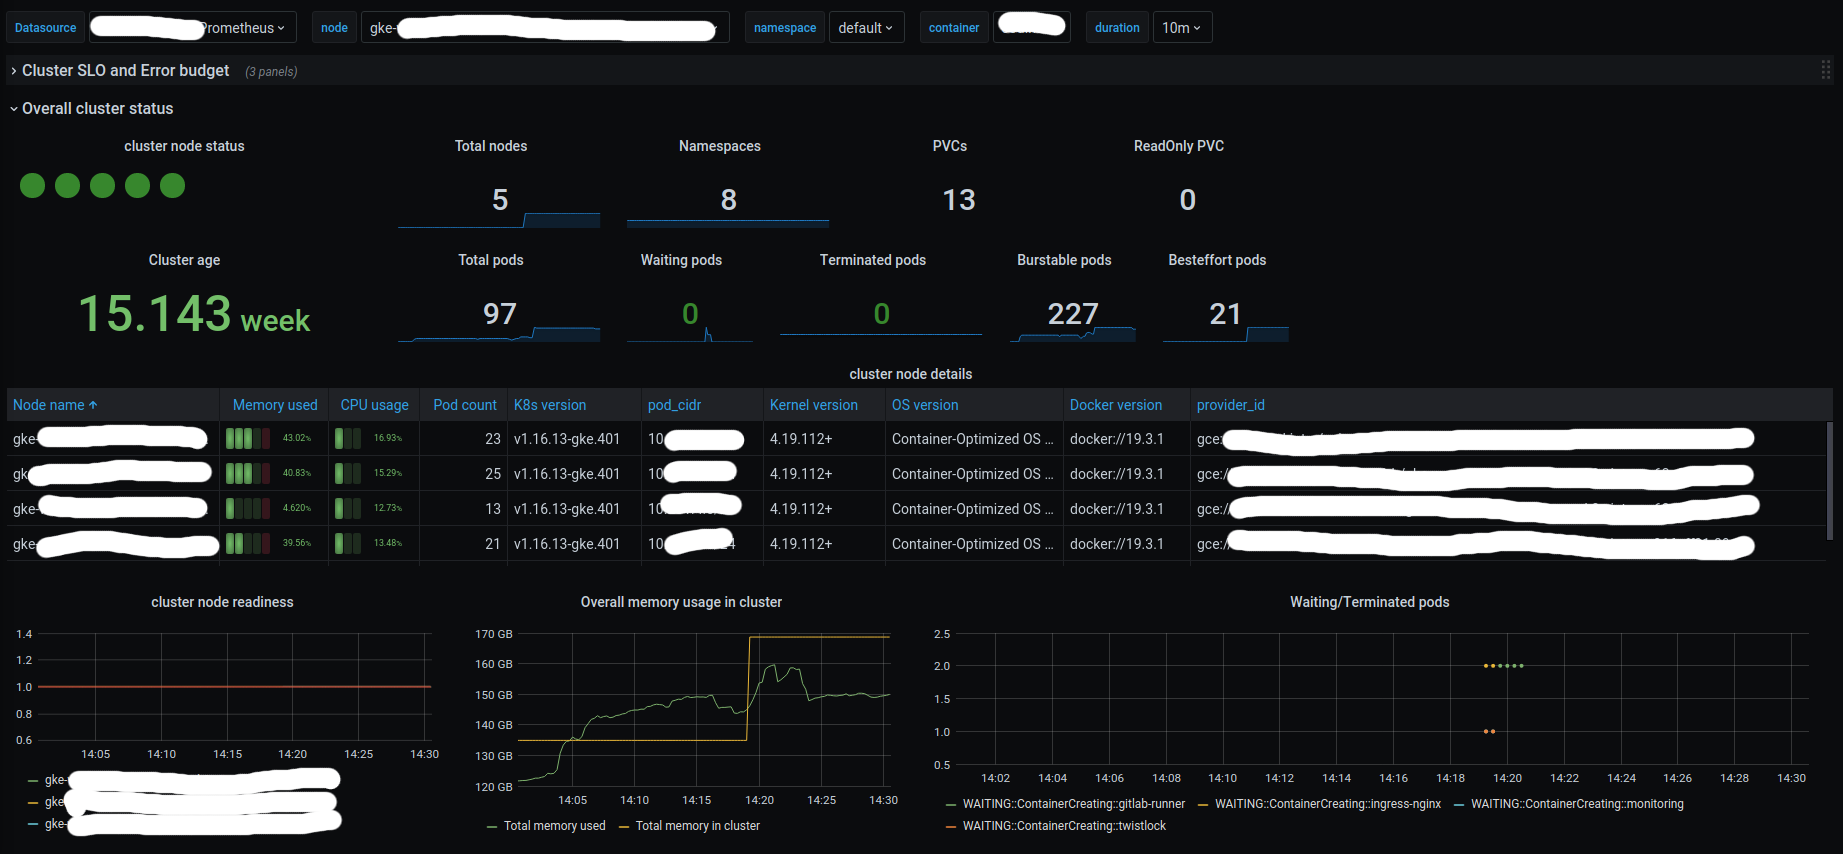
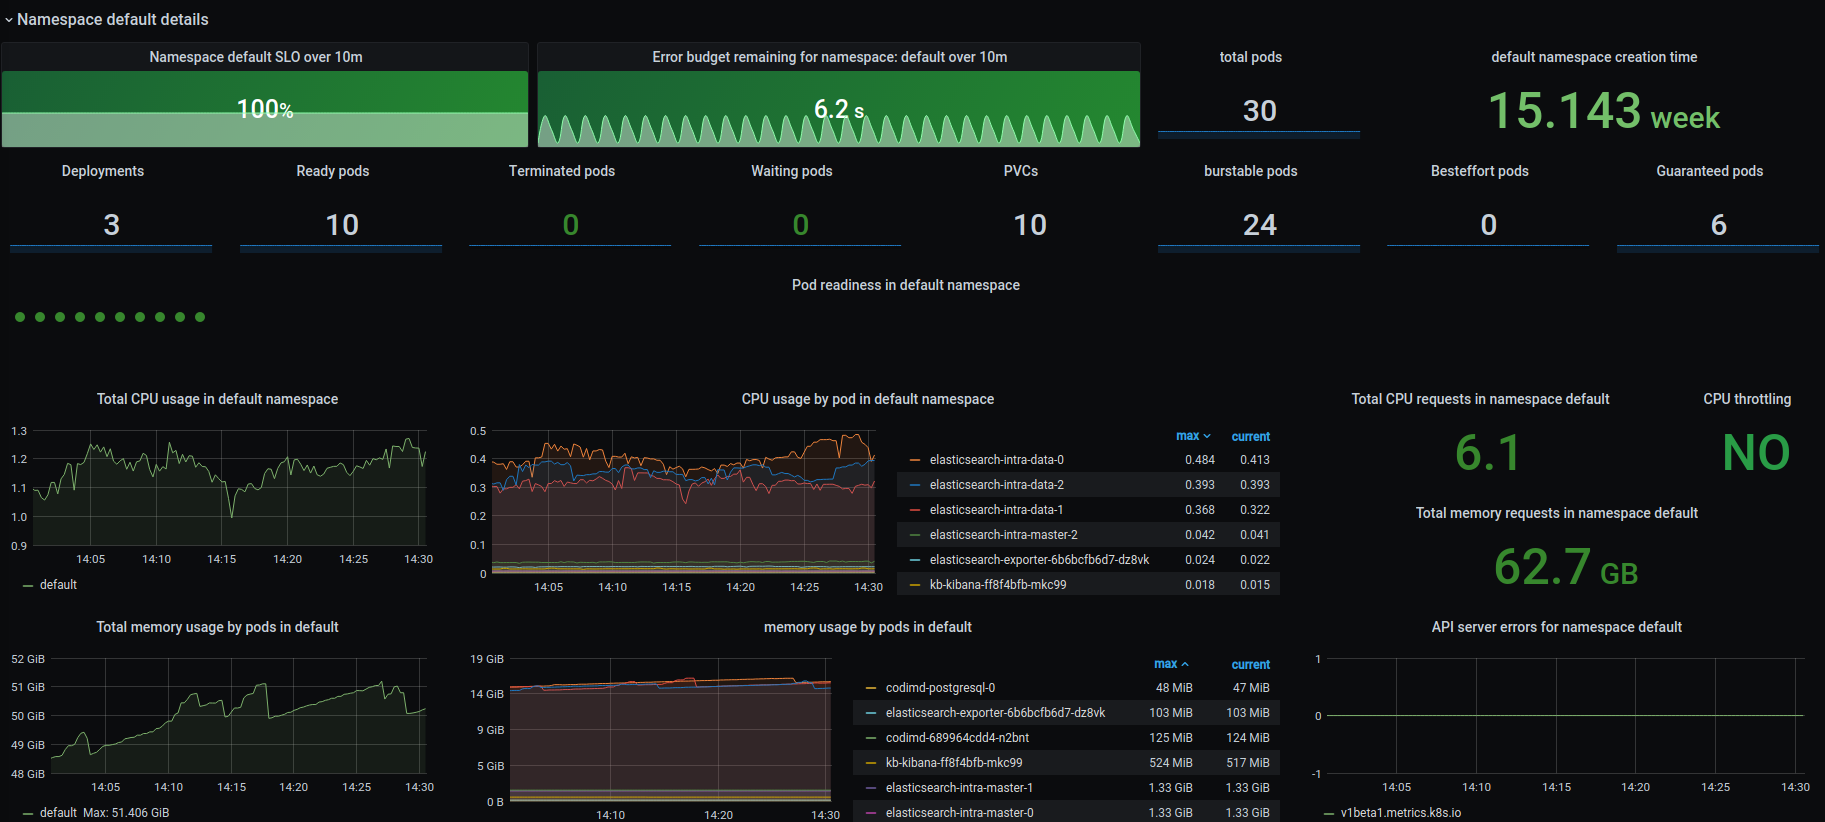
The Kubernetes Cluster Overview (by Datasource) dashboard uses the prometheus data source to create a Grafana dashboard with the bargauge, btplc-status-dot-panel, graph, singlestat, stat and table panels.
Data source config
Collector type:
Collector plugins:
Collector config:
Revisions
Upload an updated version of an exported dashboard.json file from Grafana
| Revision | Description | Created | |
|---|---|---|---|
| Download |
Kubernetes
Monitor your Kubernetes deployment with prebuilt visualizations that allow you to drill down from a high-level cluster overview to pod-specific details in minutes.
Learn more