Windows Node
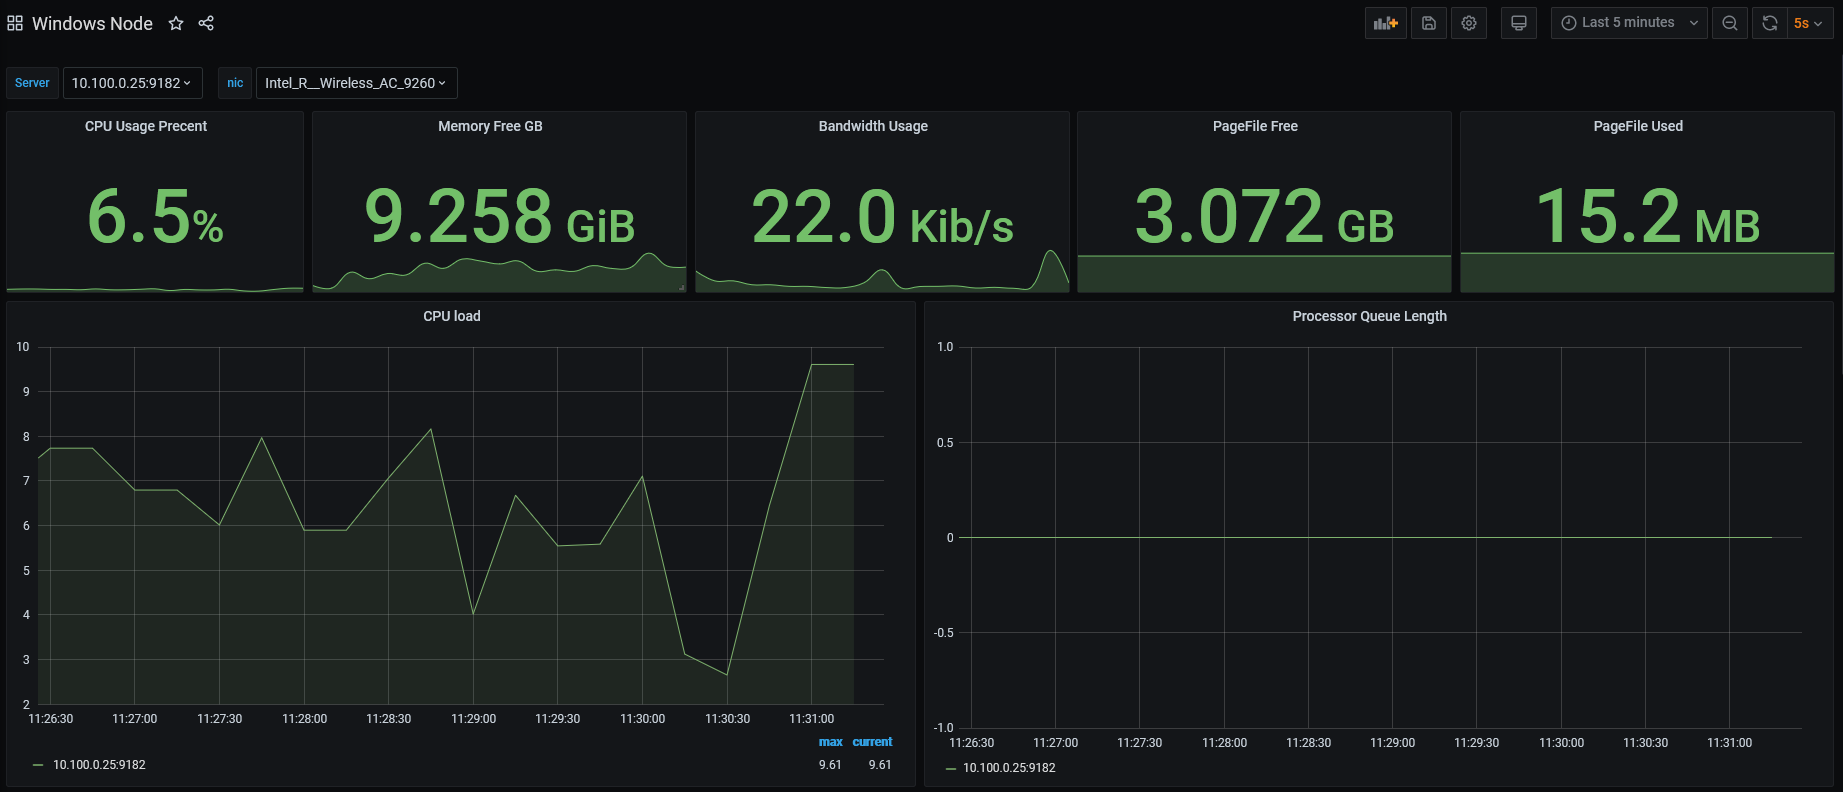
General stats dashboard with node selector, uses metrics from wmi_exporter
Running on target hosts the msi for windows_exporter
https://github.com/prometheus-community/windows_exporter/releases/tag/v0.16.0
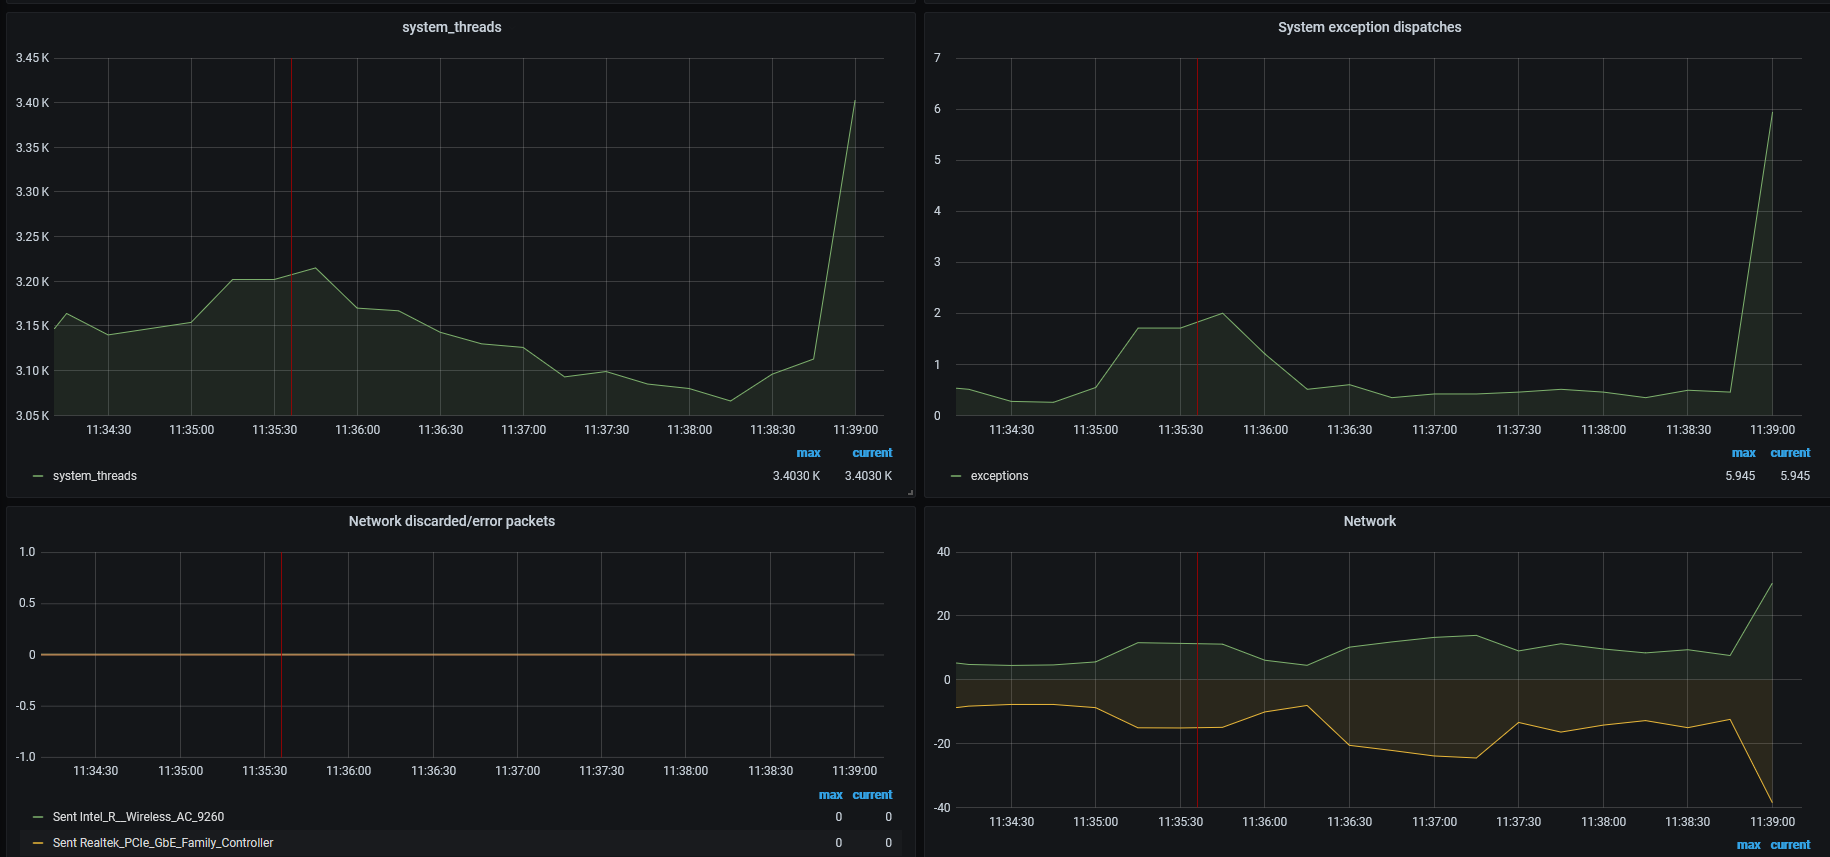
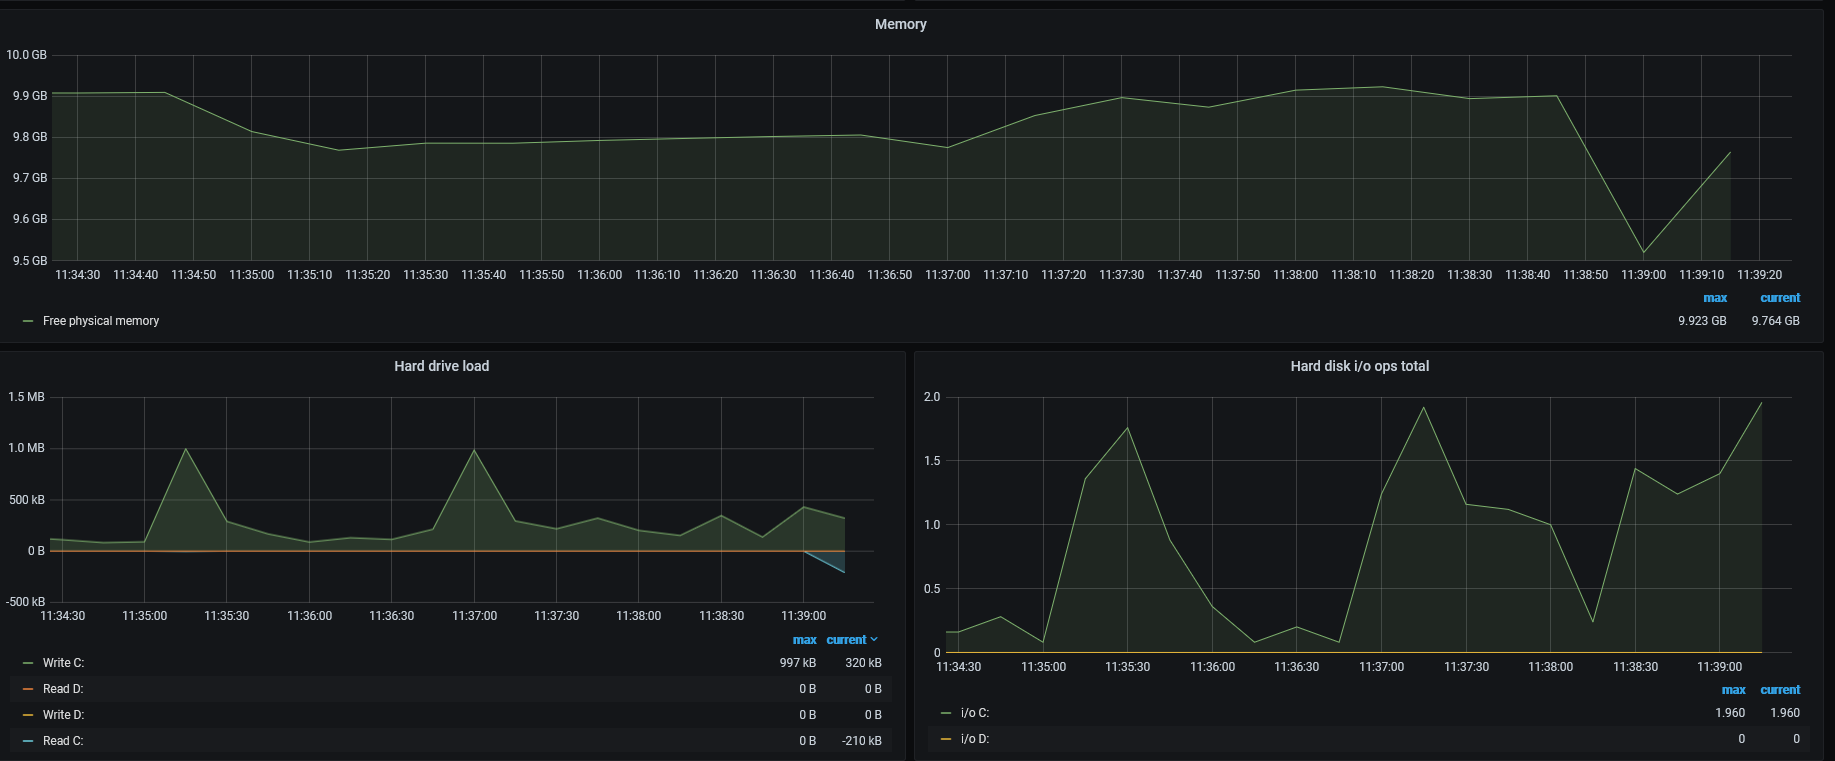
Displays: CPU, Memory, Disk, Network, Thermal
Make sure when you install the exporter to enable thermals
msiexec /i C:\Users\Administrator\Downloads\windows_exporter.msi ENABLED_COLLECTORS="[defaults],memory,thermalzone"
And display them in couple on nice ways
Data source config
Collector config:
Upload an updated version of an exported dashboard.json file from Grafana
| Revision | Description | Created | |
|---|---|---|---|
| Download |
Linux Server
Monitor Linux with Grafana. Easily monitor your Linux deployment with Grafana Cloud's out-of-the-box monitoring solution.
Learn more


