Container in Docker and System Monitoring
Esse dashboard foi desenvolvido em conjunto dos exportadores cAdvisor + Prometheus + Node Exporter.
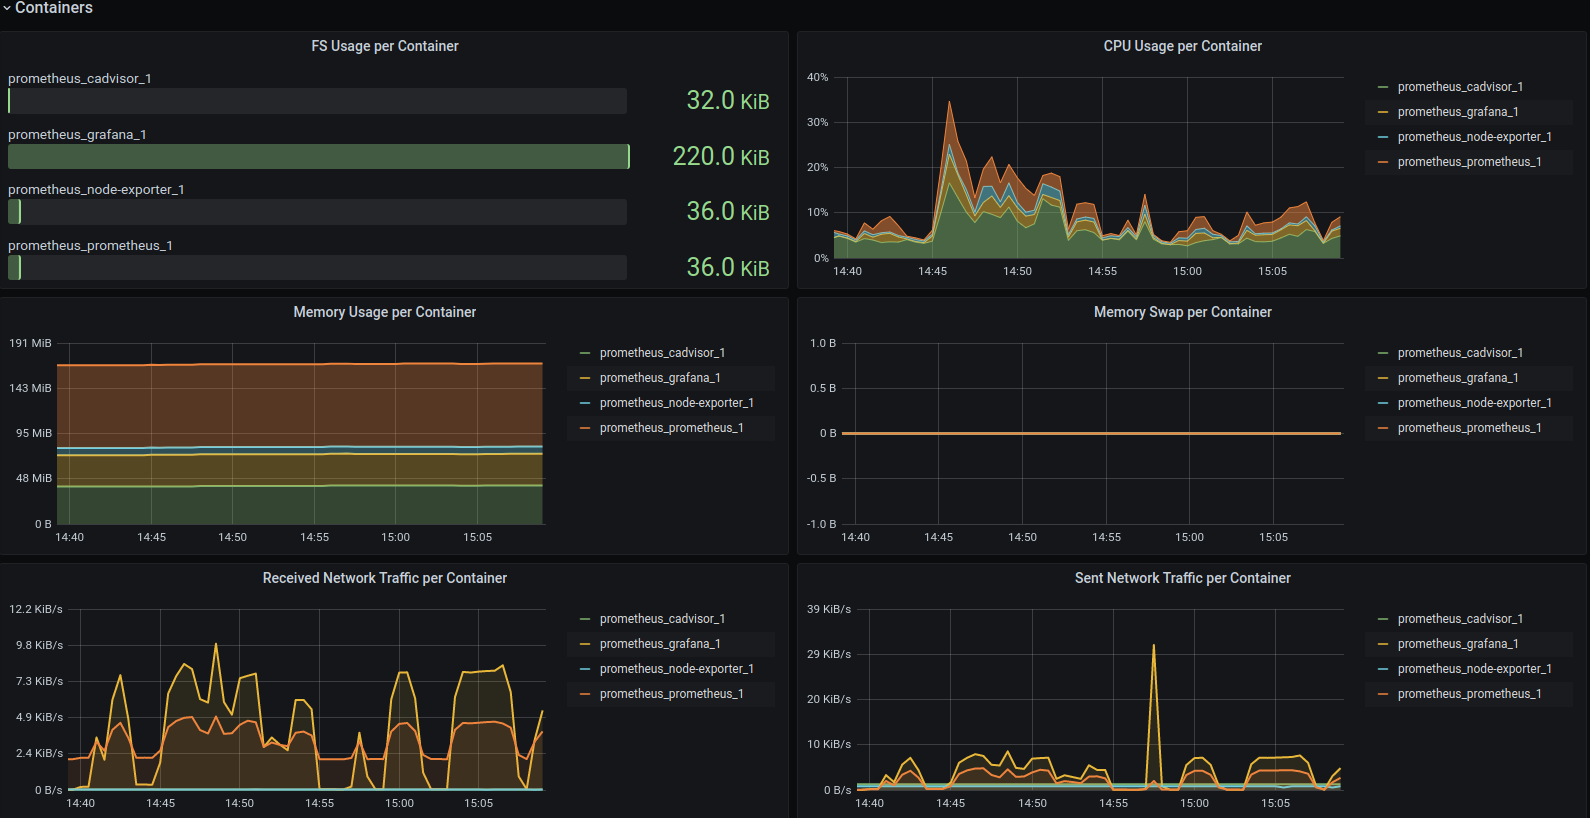
The Container in Docker and System Monitoring dashboard uses the prometheus data source to create a Grafana dashboard with the bargauge, graph, singlestat and stat panels.
Data source config
Collector type:
Collector plugins:
Collector config:
Revisions
Upload an updated version of an exported dashboard.json file from Grafana
| Revision | Description | Created | |
|---|---|---|---|
| Download |
Docker
Easily monitor Docker with Grafana Cloud's out-of-the-box monitoring solution.
Learn more