InfluxDB Overview
A beautiful one-stop-shop dashboard to monitor ALL your Influx instances. Both Influx specific metrics, as well key OS metrics.
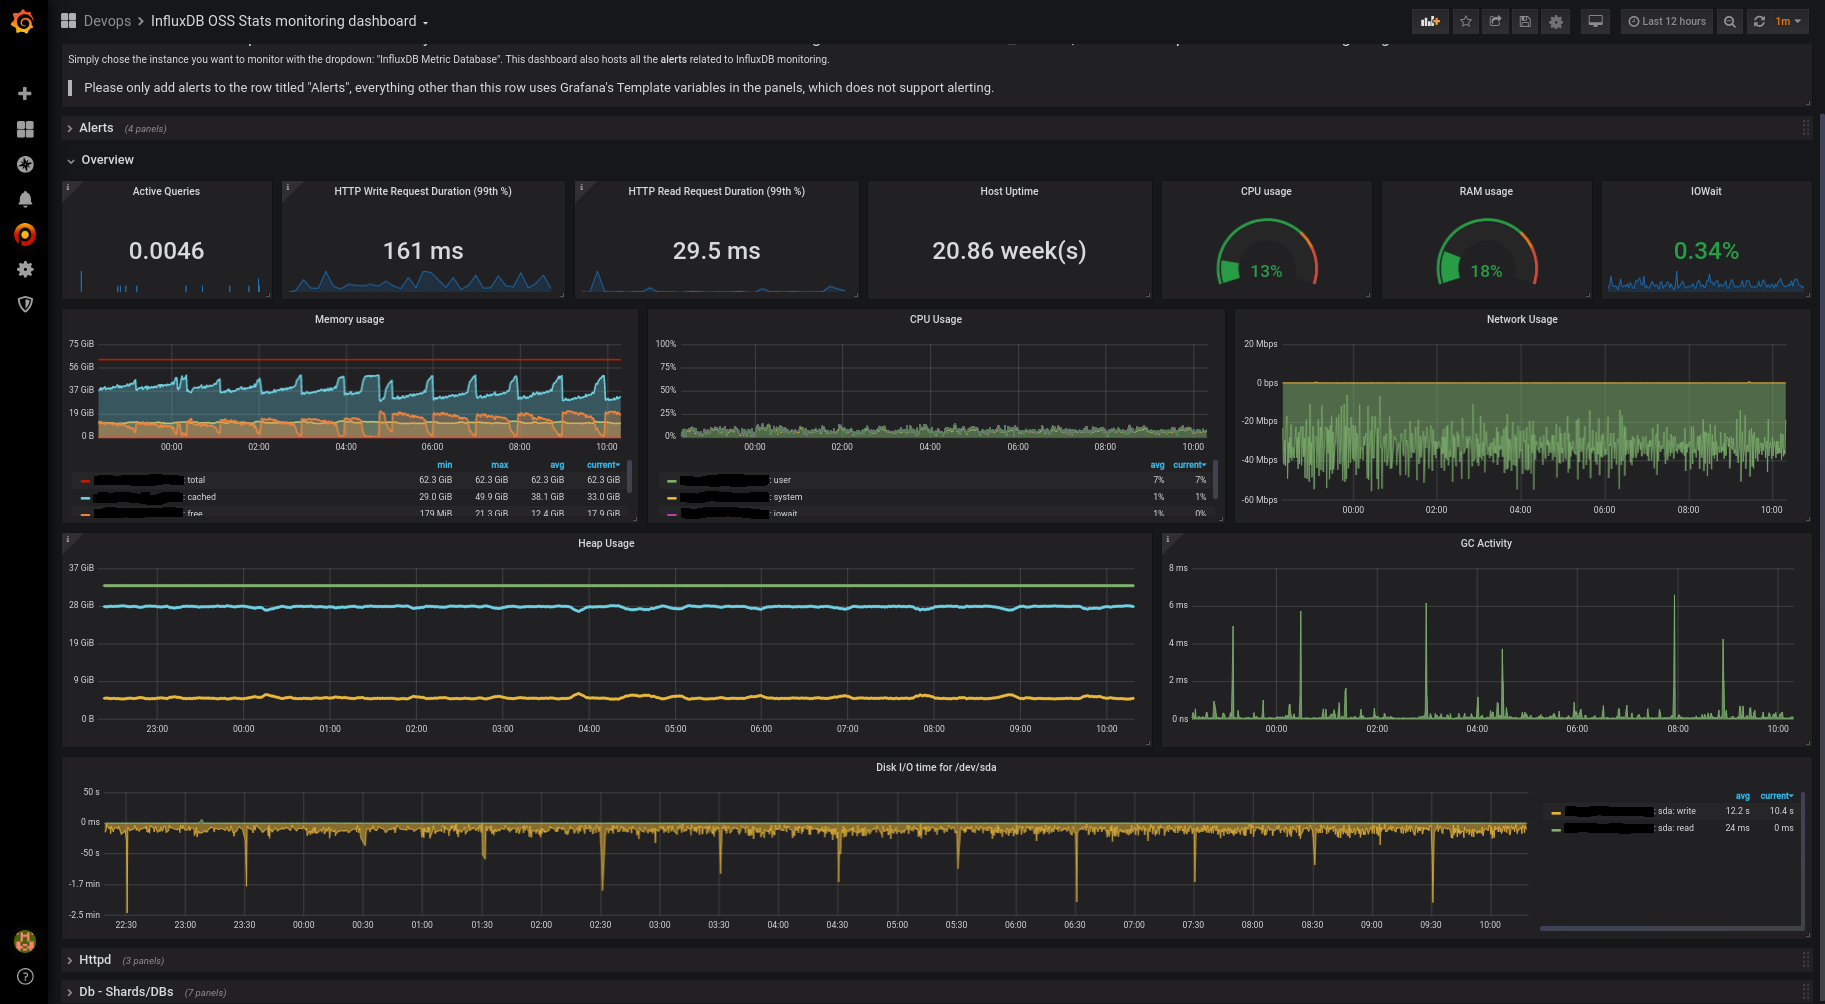
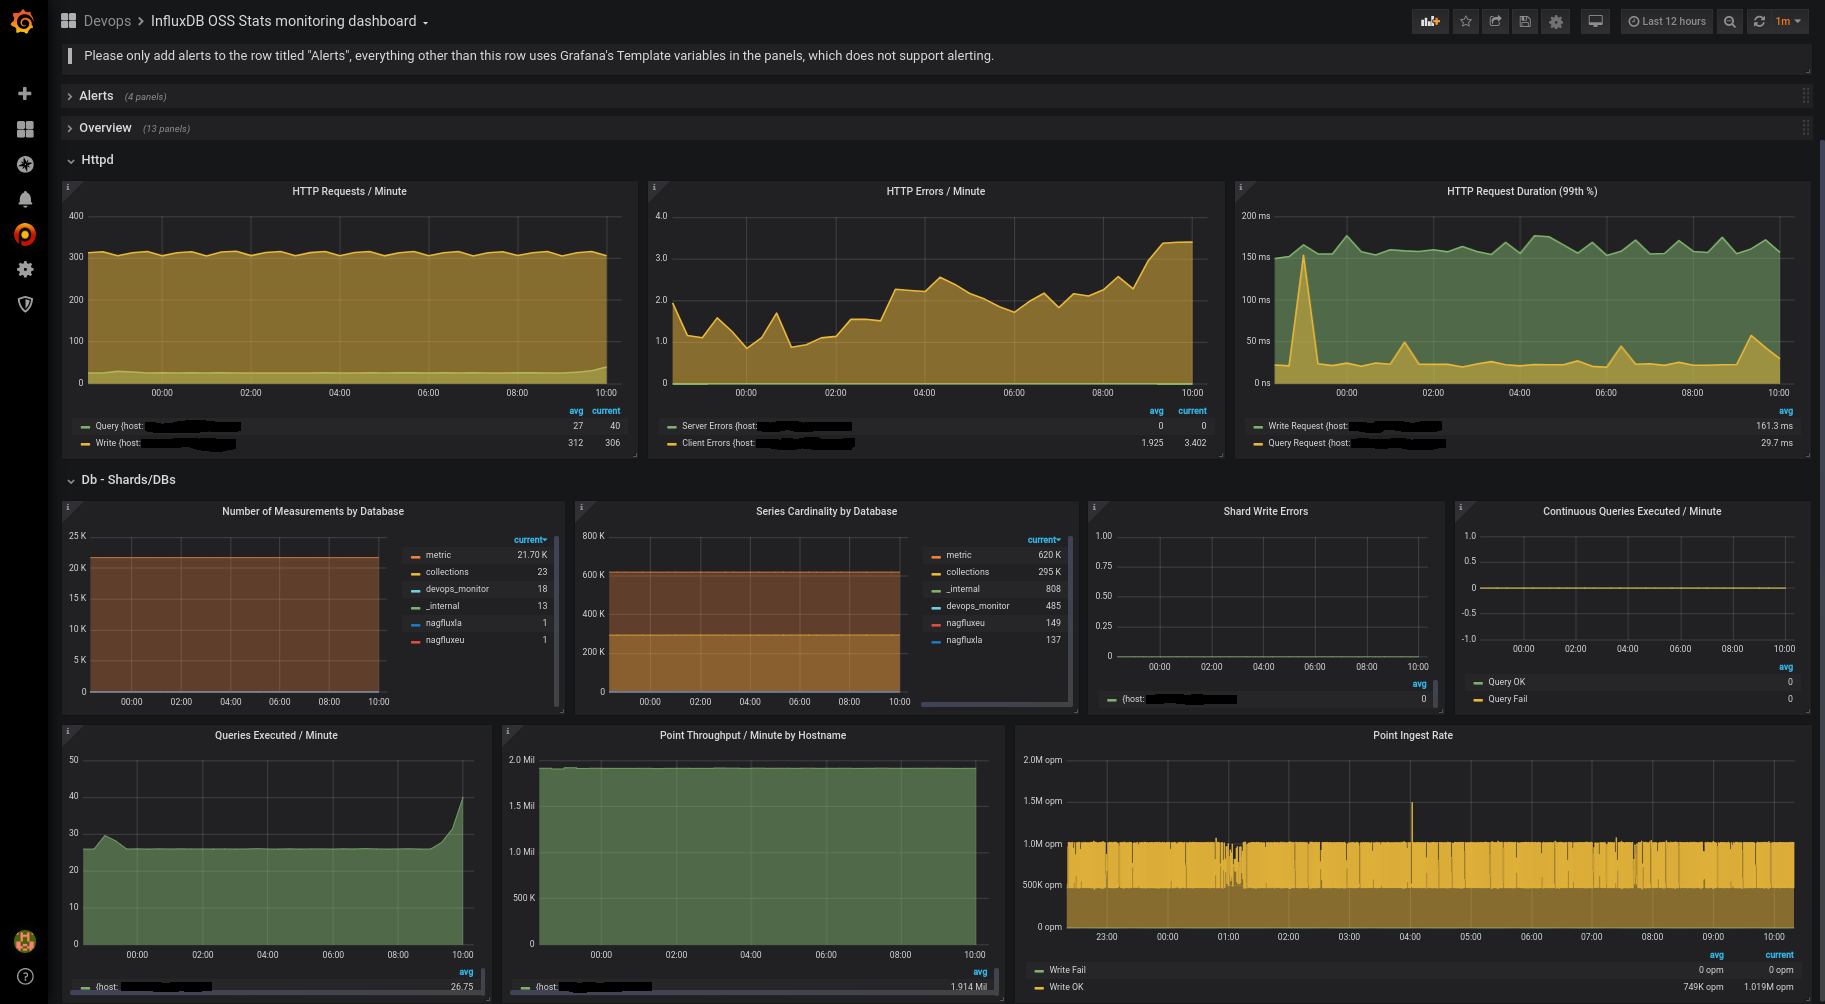
InfluxDB Overview
This dashboard extends the original OSS stats dashboard (https://docs.influxdata.com/platform/monitoring/influxdata-platform/monitoring-dashboards/).
It is meant to be a standalone dashboard that monitors everything related to InfluxDB, including important OS metrics. So you can get all the info in a single page.
Instructions
- Since the dashboard uses a template variable for the datasource, you need to have an InfluxDB Grafana Datasource using the "_internal" db. The name you give to this datasource must contain "internal", or "Internal" somewhere in it to be picked up the the template variable $datasource, if it isn't then you'll need to adjust the regex accordingly in the dashboard settings > variables. Current regex: /[Ii]nternal/.
- There are also a few panels using Telegraf OS metrics collector using the default "telegraf" db. This is optional but I highly recommend you do this since it has saved me a few times.
I hope this made using Influx a little more enjoyable. I use this to monitor multiple InfluxDB instances hosted on different base OSes, this dashboard cover all of my needs. Thank you!
Data source config
Collector config:
Upload an updated version of an exported dashboard.json file from Grafana
| Revision | Description | Created | |
|---|---|---|---|
| Download |
InfluxDB
Easily monitor InfluxDB, an open source time series database, with Grafana Cloud's out-of-the-box monitoring solution.
Learn more