K8S Dashboard CN 20240513 StarsL.cn
【中文版本】2024.05.13更新,kubernetes资源全面展示!包含K8S整体资源总览、微服务资源明细、Pod资源明细及K8S网络带宽,优化重要指标展示。https://grafana.com/orgs/starsliao/dashboards
Kubernetes Grafana看板更新啦!kube-state-metrics部署与JOB配置说明
https://mp.weixin.qq.com/s/R88DraaaS3bpm3PurzpP9g
注意:看板中的数据源变量origin_prometheus,取自于Prometheus的外部系统标签:external_labels,可用于支持多个Prometheus接入VictoriaMetrics或Thanos等第三方存储使用remote_write方式的场景。(默认取值空,指标中无该标签不影响使用)
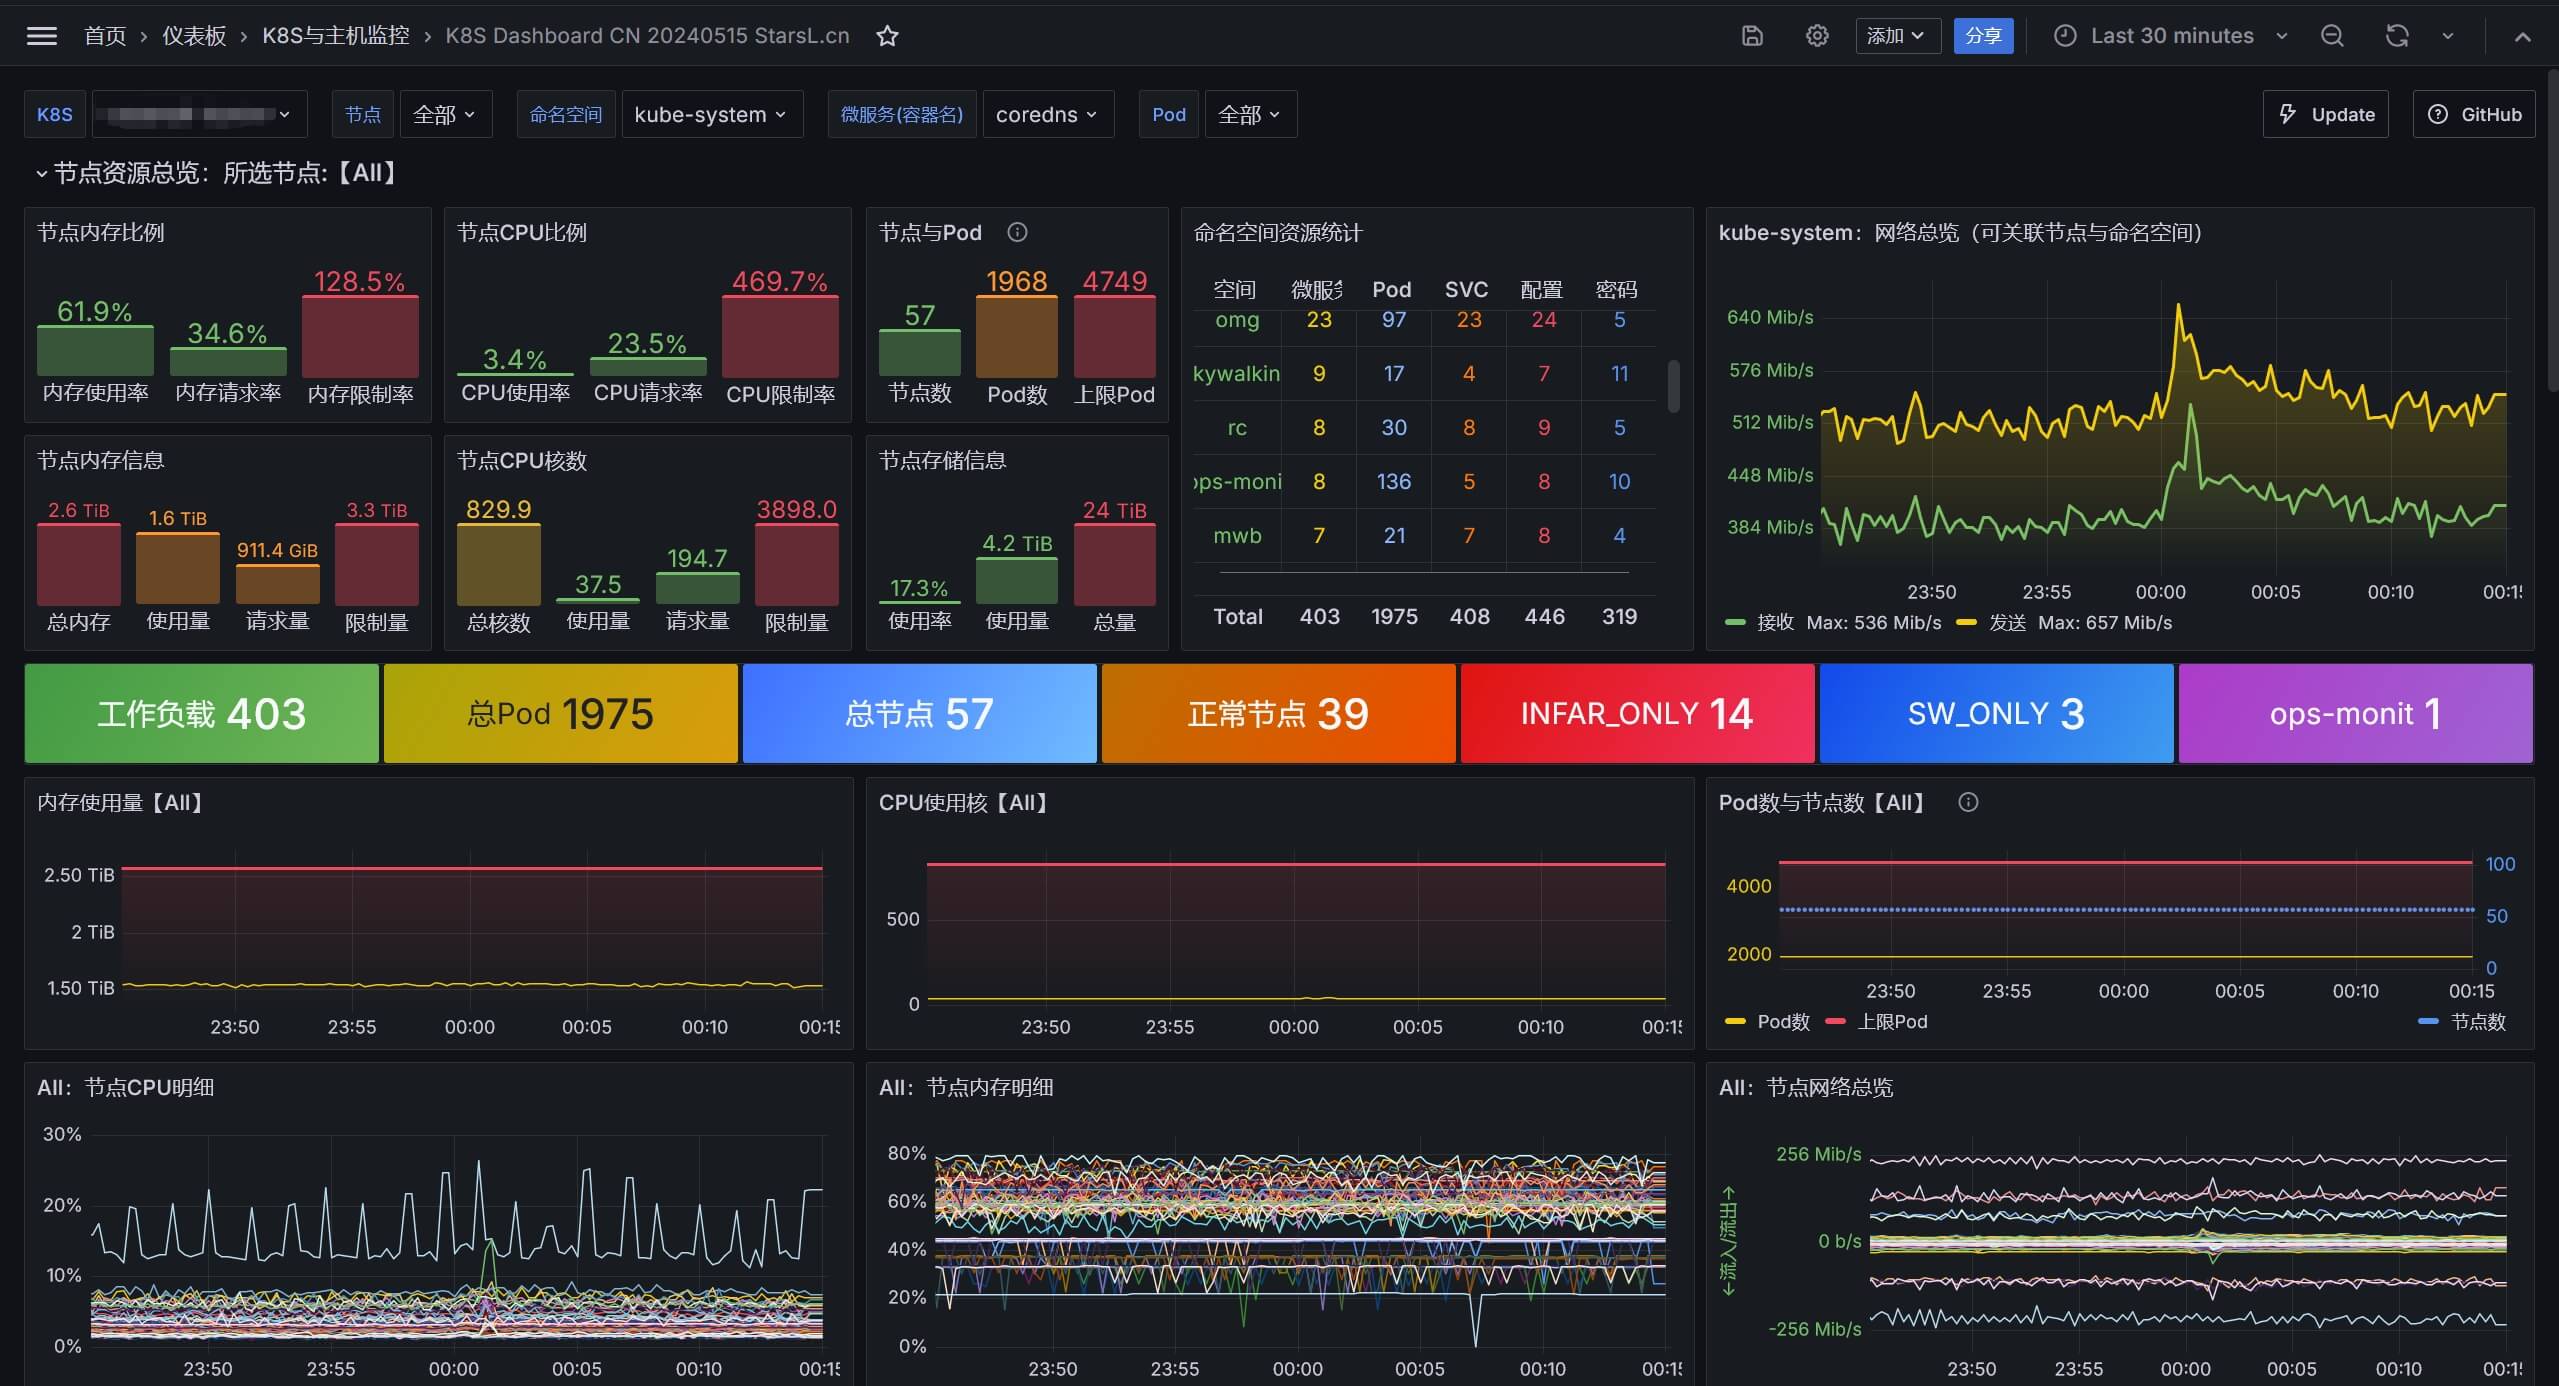
kubernetes资源全面展示!包含K8S整体资源总览、微服务资源明细、Pod资源明细及K8S网络带宽,优化重要指标展示。
更新说明
v20240513
- 更新了看板的所有Panel支持最新样式,优化展示性能,已兼容Grafana10.X版本.
- 增加了K8S总体的状态条展示节点与微服务资源的统计.
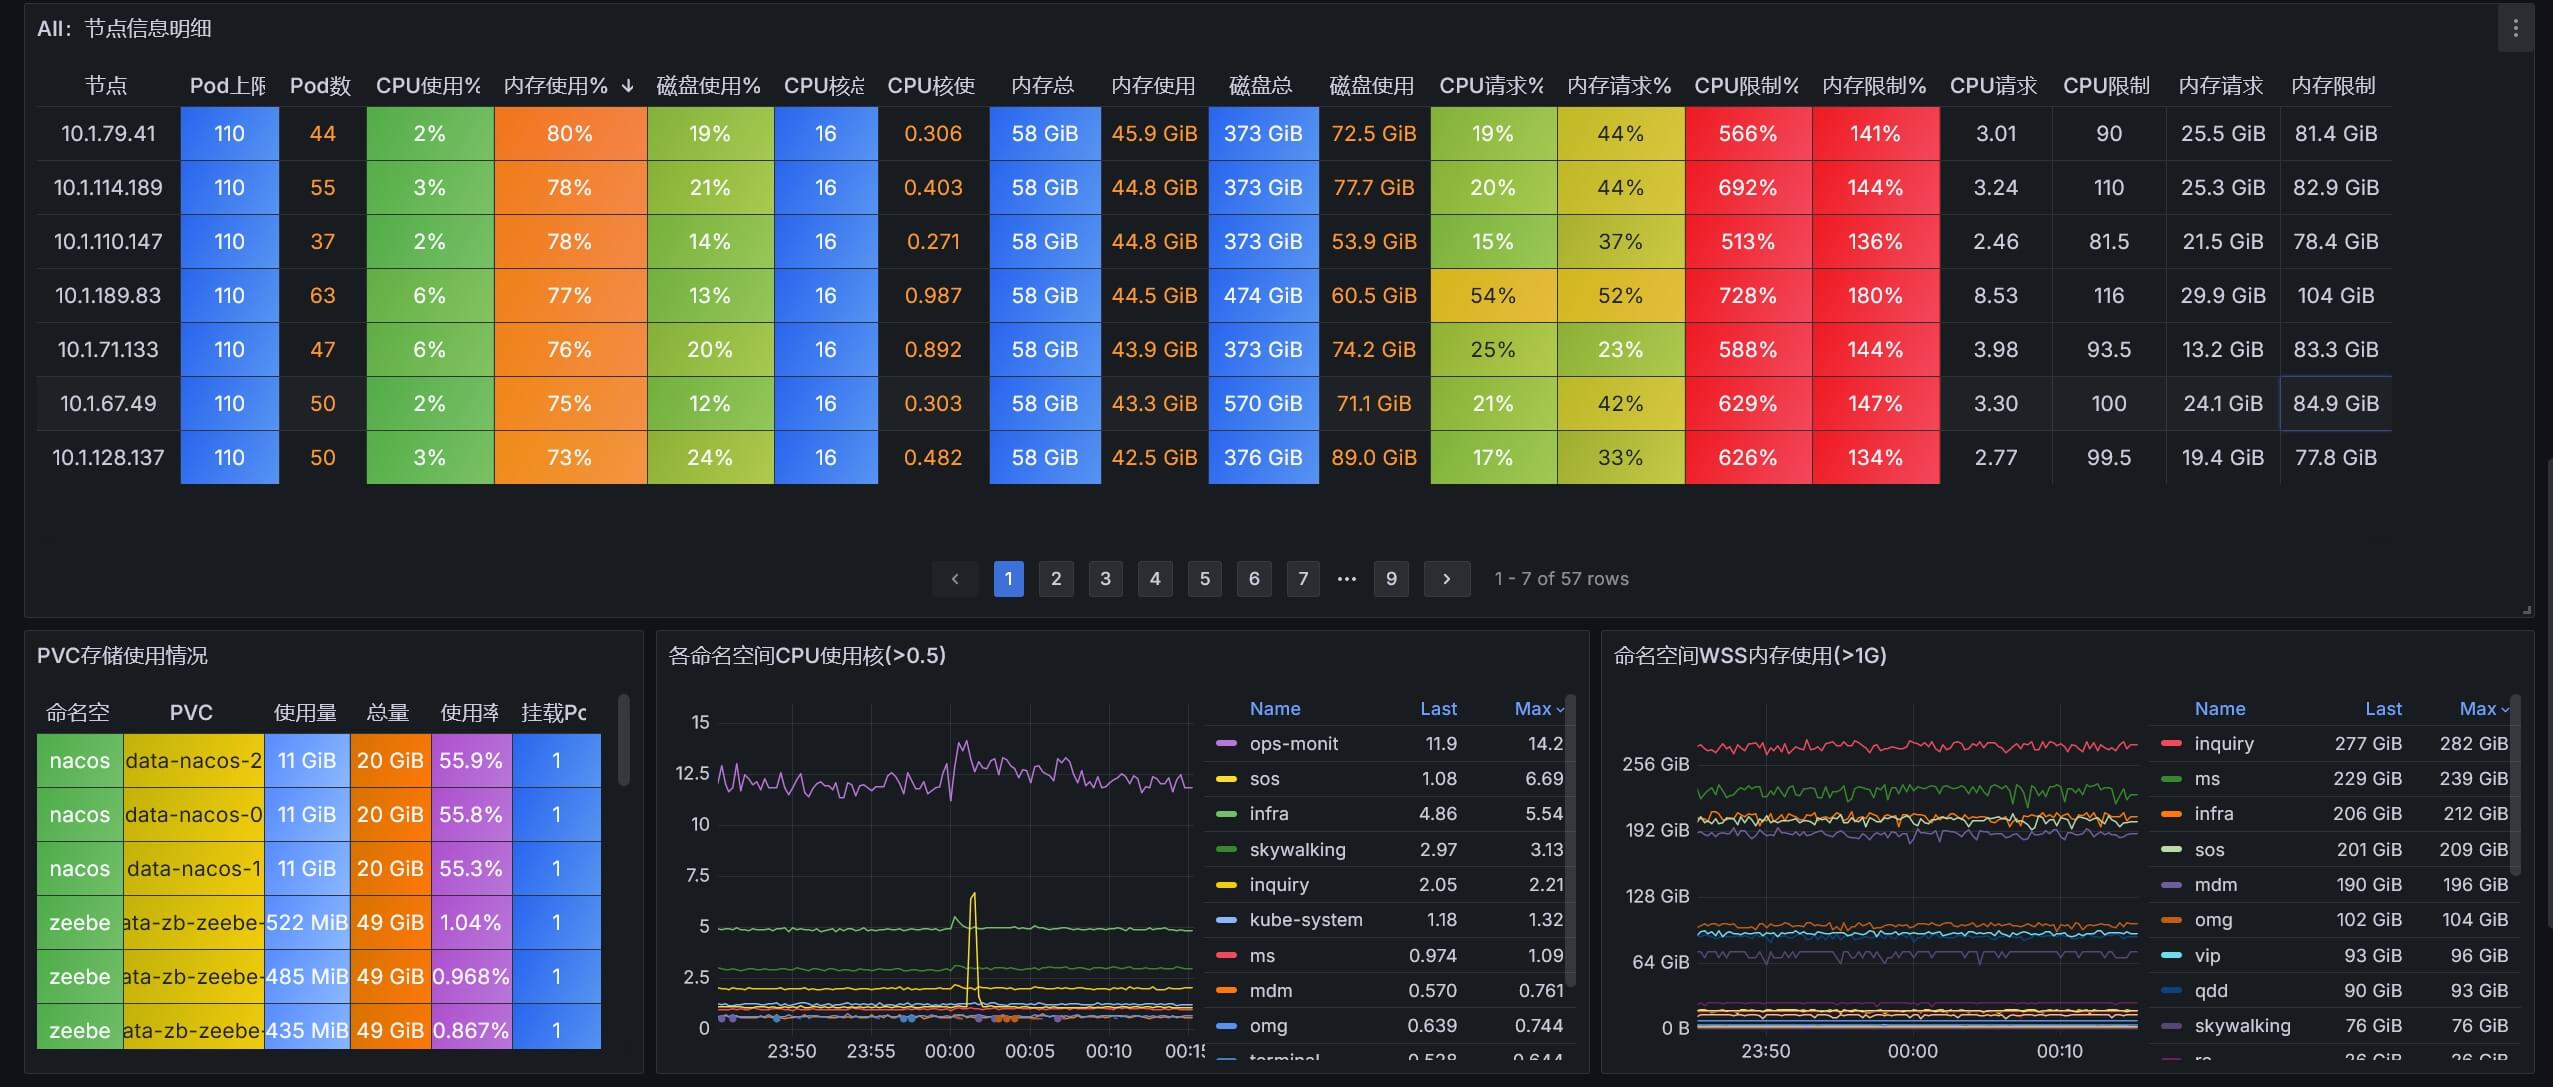
- 增加了PVC的使用情况,各命名空间的CPU,内存使用曲线图.
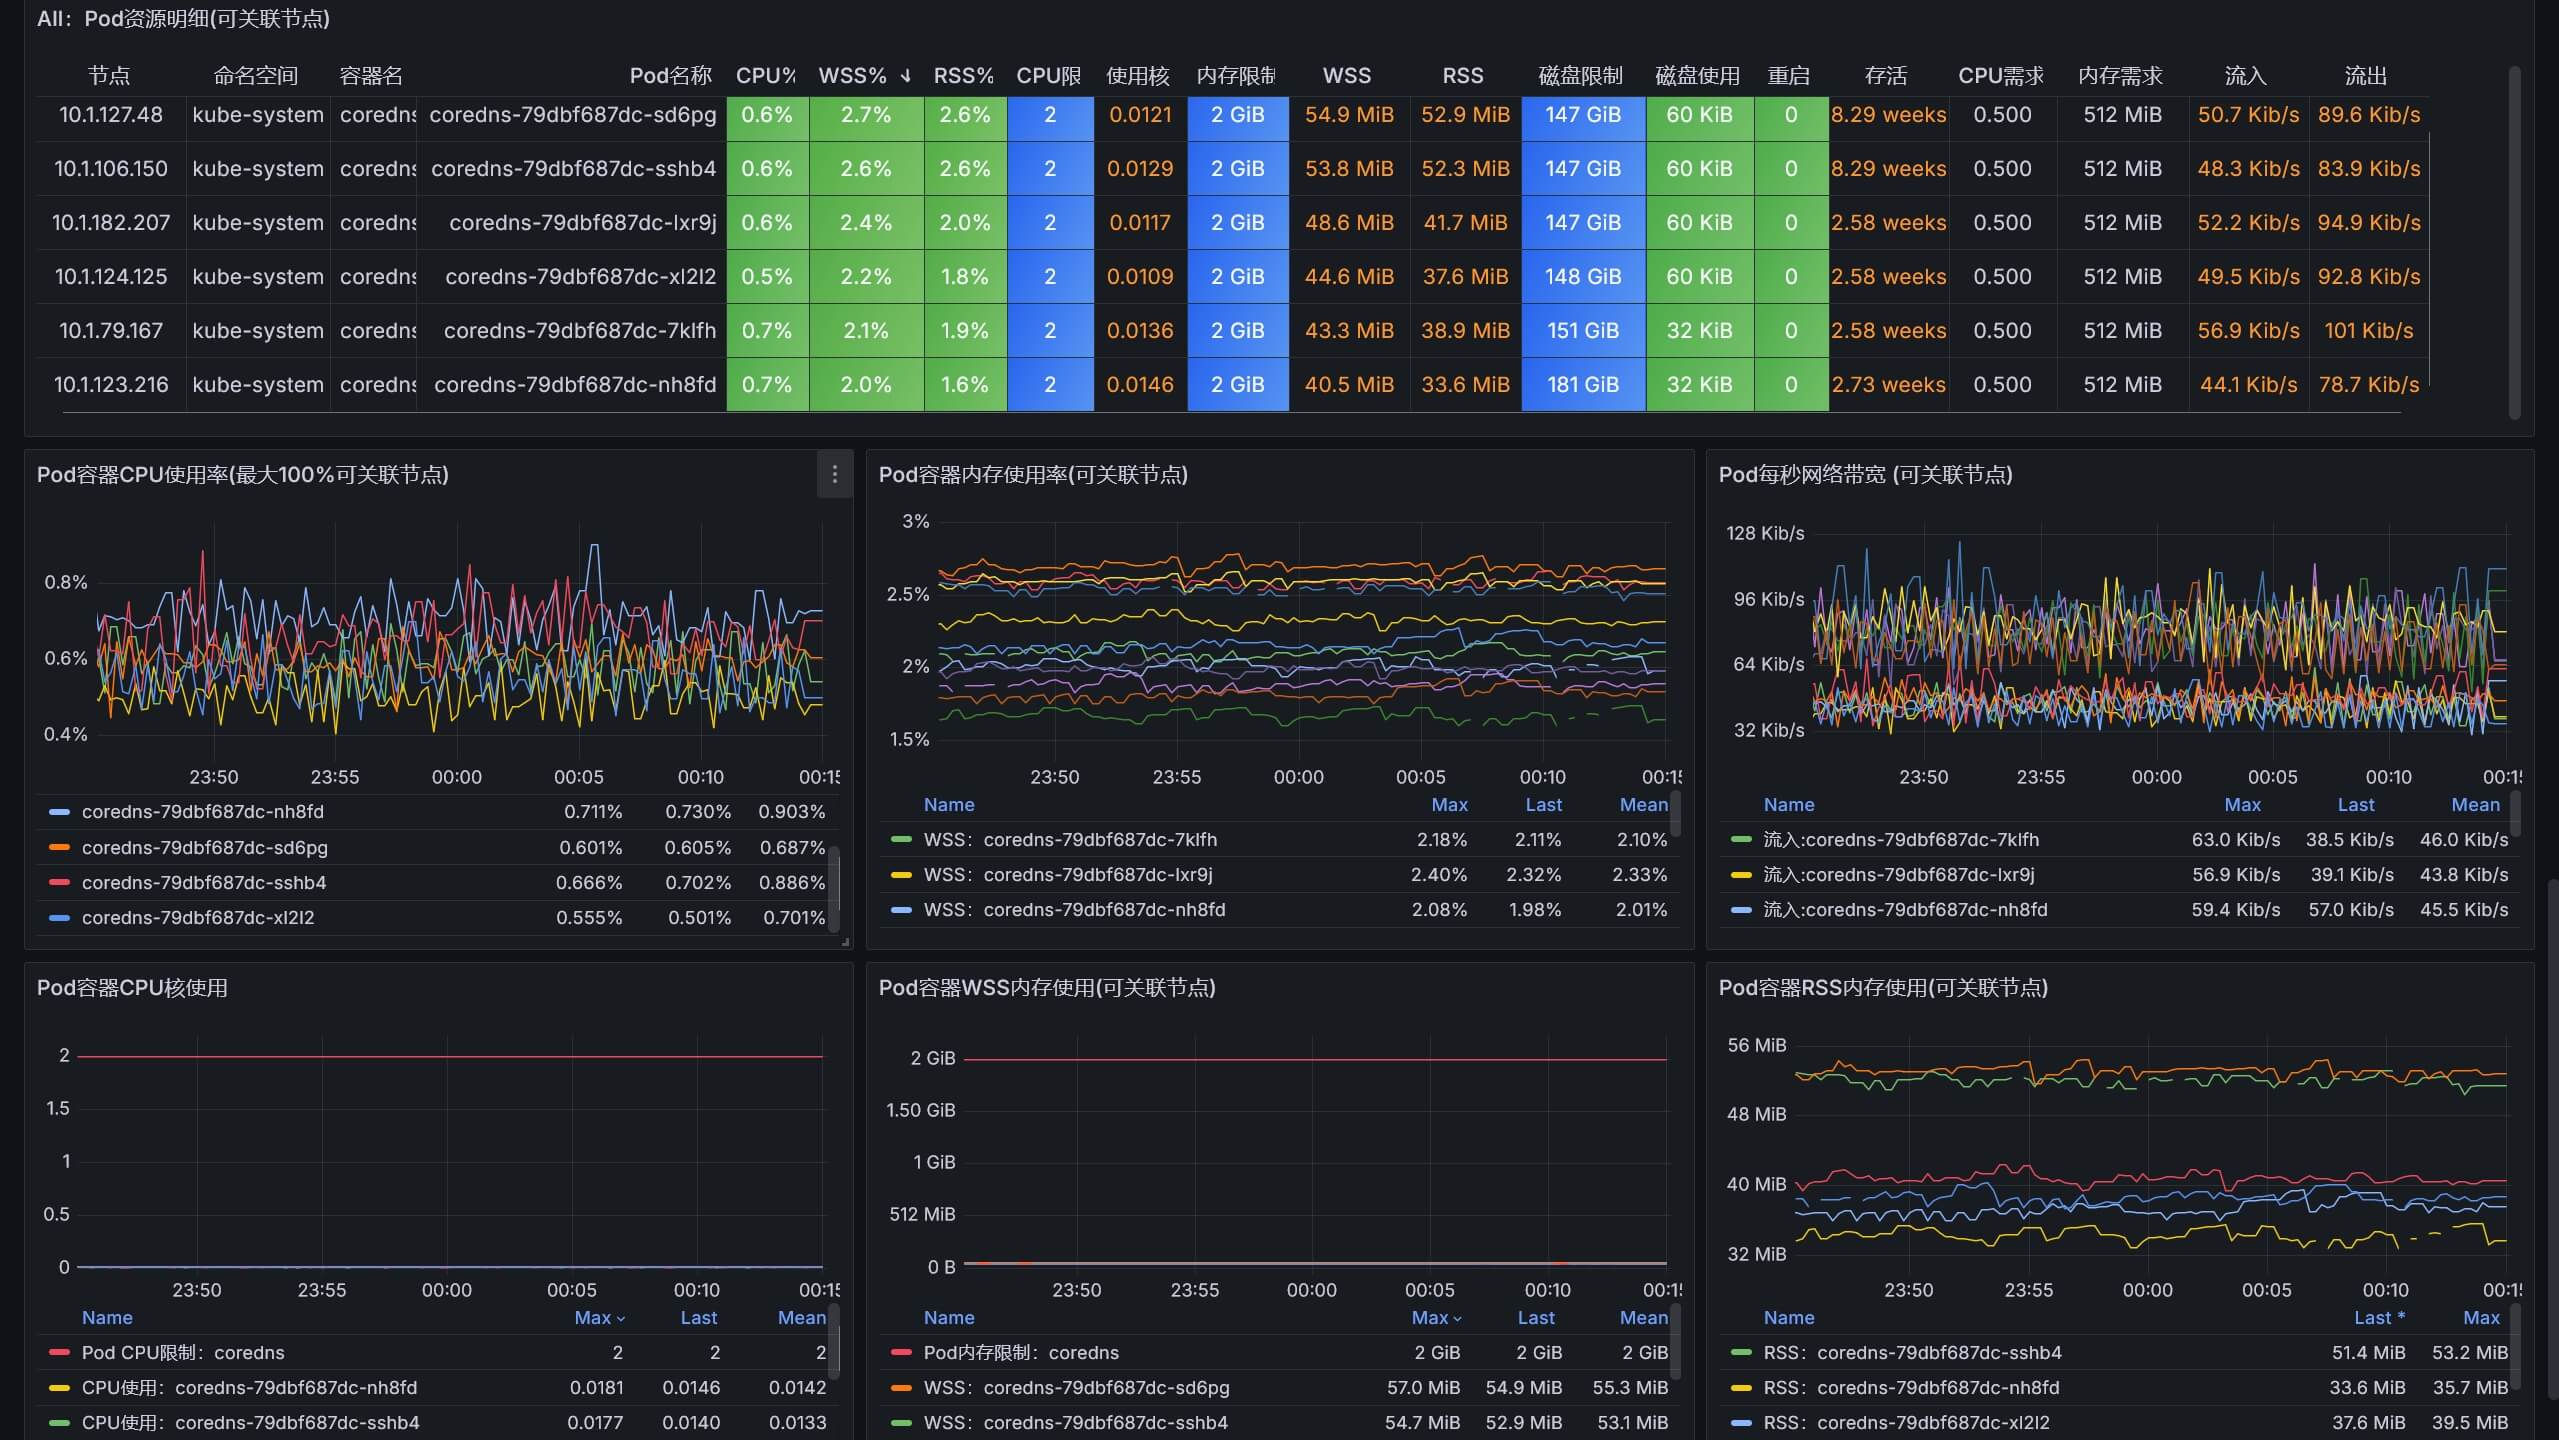
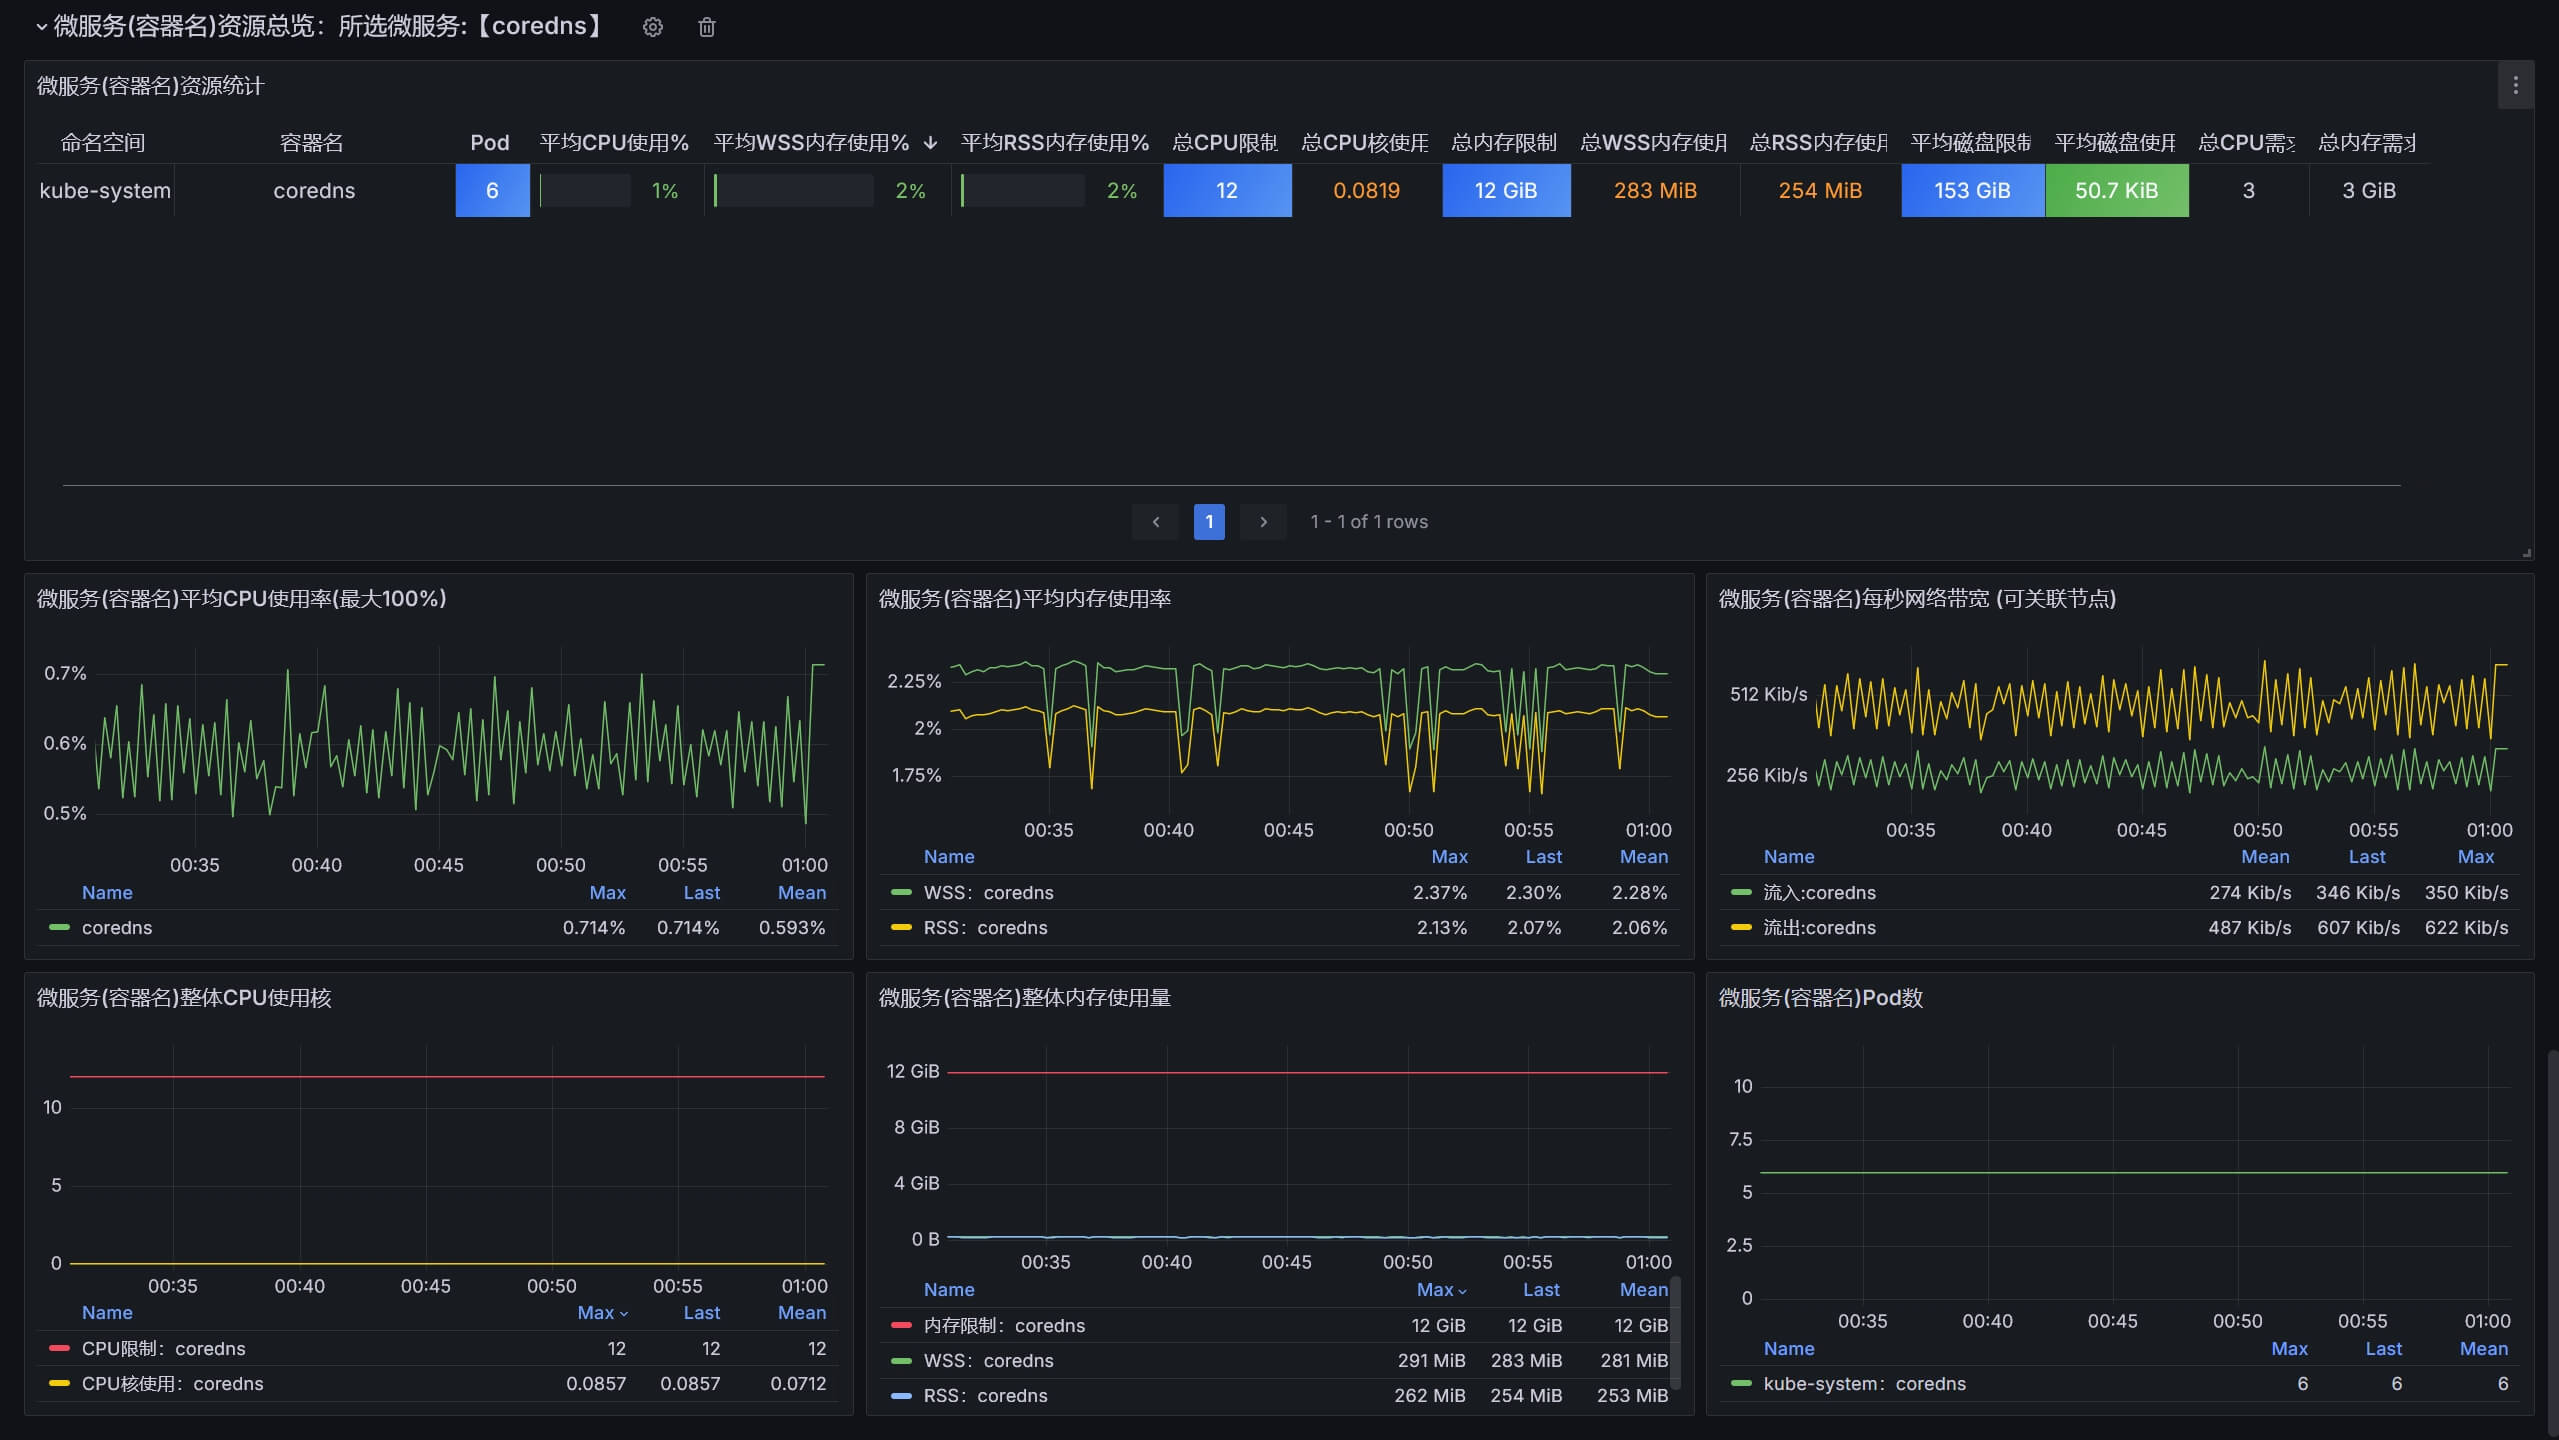
- 优化了Pod与微服务资源明细表格的展示字段与视觉效果.
- 优化了Pod与微服务CPU与内存使用量的曲线图中可以直接展示出该资源的Limit值红线.
- 修复了Pod重启导致短时间内展示的Pod资源数据不准确的BUG.
- 调整了多个图表,曲线图的展示效果与描述,优化部分指标数据更加精准。
- 增加了各个版本的kube-state-metrics国内镜像.参考【这里】
- 增加了Prometheus on K8S的JOB配置说明.
截图
整体资源总览


Pod资源明细

微服务资源明细

赞赏与关注公众号【云原生DevOps】加入交流群(请备注:K8S),获取更多...
如果看不到图片请点击该链接:https://starsl.cn/static/img/thanks.png

看板下载
- Grafana看板ID:13105
- Grafana看板地址:https://grafana.com/grafana/dashboards/13105
- 项目仓库:https://github.com/starsliao/Prometheus/tree/master/kubernetes
Data source config
Collector type:
Collector plugins:
Collector config:
Revisions
Upload an updated version of an exported dashboard.json file from Grafana
| Revision | Description | Created | |
|---|---|---|---|
| Download |
Kubernetes
Monitor your Kubernetes deployment with prebuilt visualizations that allow you to drill down from a high-level cluster overview to pod-specific details in minutes.
Learn more