
Centrifugo
Official dashboard for the Centrifugo real-time messaging server (https://centrifugal.dev). Covers connections, client commands, delivery, recovery, server API, proxies, consumers, brokers and Go runtime, plus collapsed rows for Centrifugo PRO metrics. Uses histogram metrics only — Prometheus Summaries are deprecated in Centrifugo v6.8.1 and removed in v7.
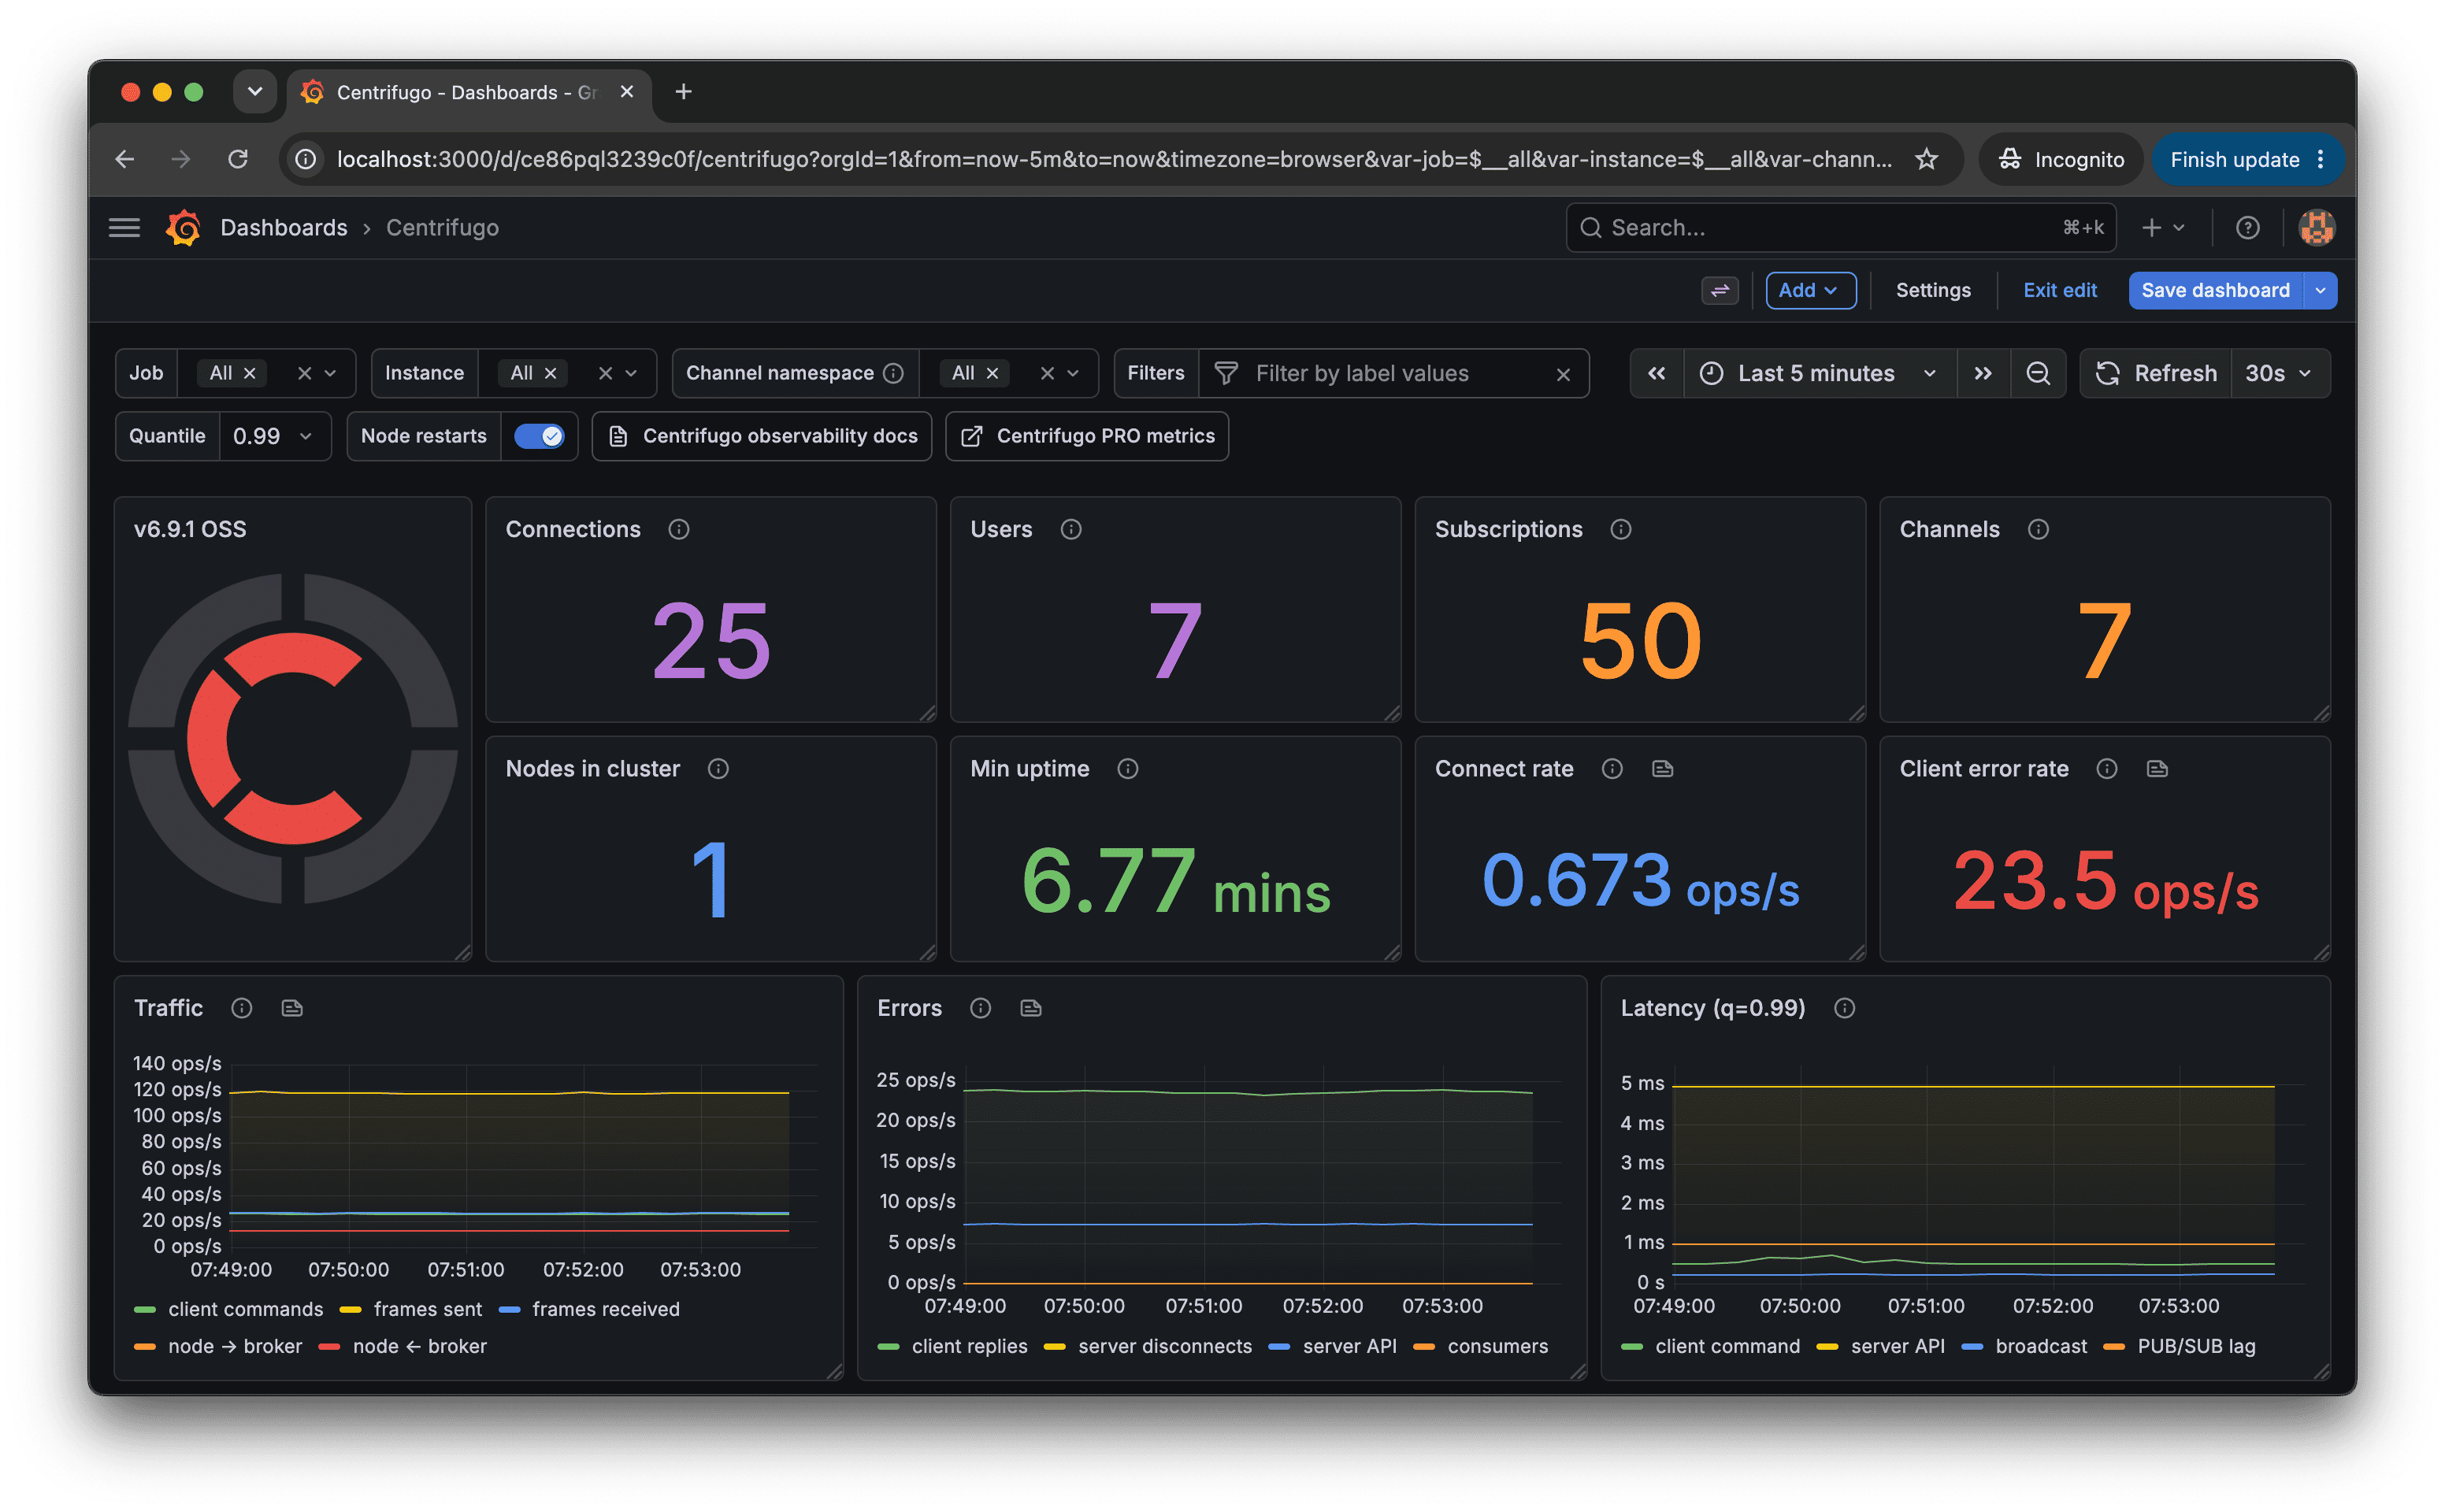
Official Grafana dashboard for Centrifugo, the open-source real-time messaging server.
Point it at a Prometheus that scrapes Centrifugo's /metrics endpoint and it covers everything from client connections down to broker internals and Go runtime health.
Requirements
Centrifugo with Prometheus metrics enabled:
{
  "prometheus": {
    "enabled": true,
    "instrument_http_handlers": true
  }
}
Prometheus, scraping that endpoint, added as a Grafana data source. Grafana 11.4.0+ (uses the Stat, Text and Time series panels only).
No Summary metrics are used anywhere in this dashboard — Centrifugo's Summaries are deprecated as of v6.8.1 and removed in v7.
Variables
| Variable | Purpose |
|---|---|
Job / Instance | Scope every panel to one Prometheus job / instance selection. Multi-select, defaults to all. |
Channel namespace | Filters the namespace-aware panels (mainly the PRO rows below) to selected namespace(s). |
Filters | Free-form ad hoc label filters, for anything the variables above don't cover. |
Quantile | Percentile used by every latency/duration panel — 0.5 through 0.999. |
Rows
Open on load:
| Row | Panels |
|---|---|
| Overview | 12 |
| Connections and subscriptions | 11 |
| Client commands and latency | 6 |
| Real-time delivery | 10 |
Collapsed (expand what you need — nothing inside is queried until you do):
| Row | Panels |
|---|---|
| Recovery | 4 |
| Server API | 6 |
| Proxy | 5 |
| Async consumers | 2 |
| Shared poll | 10 |
| Node internals | 4 |
| Broker (Redis PUB/SUB) | 4 |
| Map broker | 6 |
| Broker (PostgreSQL) | 4 |
| Runtime and resources | 9 |
Centrifugo PRO rows
Eight further collapsed rows cover Centrifugo PRO metrics — push notifications, ClickHouse analytics, the PostgreSQL connection pool, rate limiting and channel state, Redis Cluster node-grouped PUB/SUB, and the shared-poll relay. On plain Centrifugo OSS these rows stay empty; nothing breaks, they simply have no data to show.
Links
- Exposed metrics — every metric this dashboard queries, with its type and labels.
- Centrifugo PRO metrics — what the PRO-only rows need enabled.
Data source config
Collector config:
Upload an updated version of an exported dashboard.json file from Grafana
| Revision | Description | Created | |
|---|---|---|---|
| Download |